
- Start >
- Rivers >
- Discharge >
- Naab - Regen >
- Vilseck >
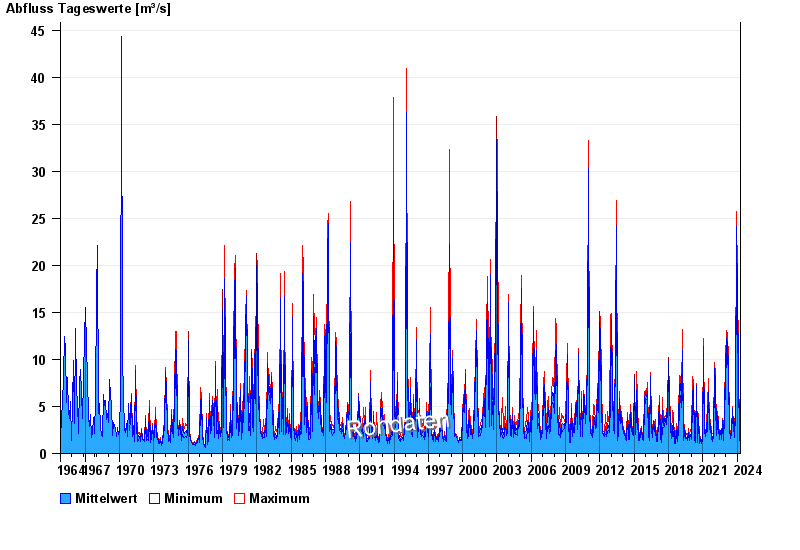
- Chart of total period

Chart of total period Vilseck / Vils
Discharge from 01.11.1964 to 20.04.2024
| Date | Mean value [m³/s] | Maximum [m³/s] | Minimum [m³/s] |
|---|---|---|---|
| 20.04.2024 | 2.72 | 2.73 | 2.66 |
| 19.04.2024 | 1.92 | 2.66 | 1.62 |
| 18.04.2024 | 1.79 | 1.96 | 1.67 |
| 17.04.2024 | 1.86 | 2.02 | 1.78 |
| 16.04.2024 | 1.57 | 2.02 | 1.38 |
| 15.04.2024 | 1.46 | 1.62 | 1.34 |
| 14.04.2024 | 1.41 | 1.52 | 1.34 |
© Bayerisches Landesamt für Umwelt 2024