
- Start >
- Rivers >
- Discharge >
- Naab - Regen >
- Vilseck >
- Chart of total period

Chart of total period Vilseck / Vils
Discharge from 01.11.1964 to 16.04.2024
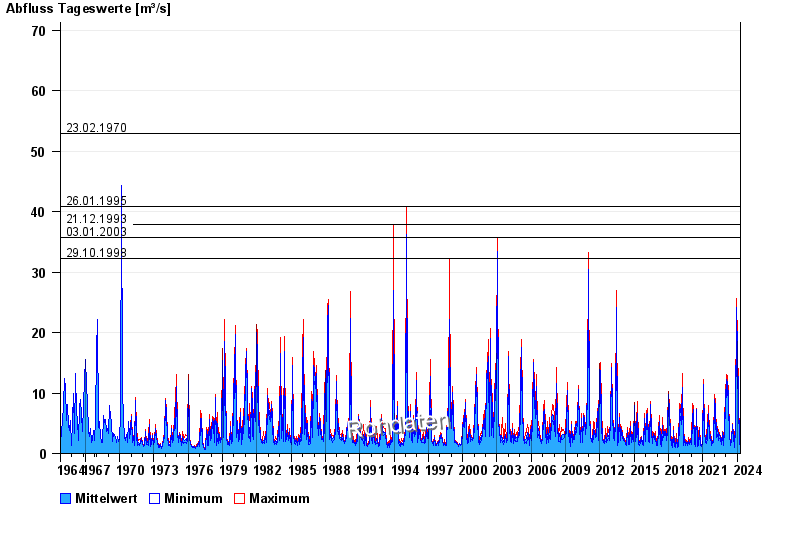
- 23.02.1970 Abfluss: 53 m³/s
- 26.01.1995 Abfluss: 40,9 m³/s
- 21.12.1993 Abfluss: 37,8 m³/s
- 03.01.2003 Abfluss: 35,8 m³/s
- 29.10.1998 Abfluss: 32,3 m³/s
| Date | Mean value [m³/s] | Maximum [m³/s] | Minimum [m³/s] |
|---|---|---|---|
| 16.04.2024 | 0.975 | 1.23 | 0.89 |
| 15.04.2024 | 0.948 | 1.06 | 0.861 |
| 14.04.2024 | 0.91 | 0.986 | 0.861 |
| 13.04.2024 | 0.933 | 1.02 | 0.861 |
| 12.04.2024 | 0.951 | 1.02 | 0.89 |
| 11.04.2024 | 1.01 | 1.14 | 0.953 |
| 10.04.2024 | 1.08 | 1.14 | 0.986 |
© Bayerisches Landesamt für Umwelt 2024