
- Start >
- Rivers >
- Discharge >
- Naab - Regen >
- Fronhof >
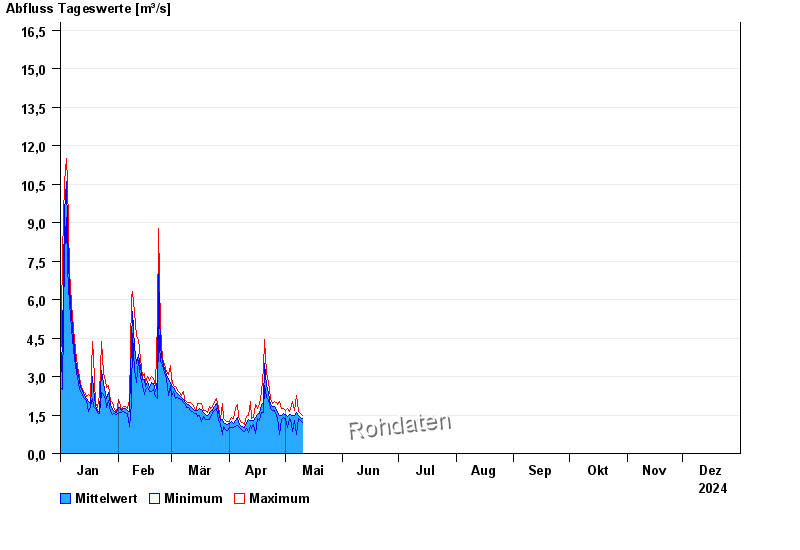
- Chart of year

Chart of year Fronhof / Murach
Discharge from 01.01.2024 to 31.12.2024
- 03.06.2013 Abfluss: 31,2 m³/s
- 26.01.1995 Abfluss: 28 m³/s
- 13.02.2005 Abfluss: 23 m³/s
- 14.01.2011 Abfluss: 22,8 m³/s
- 21.12.1993 Abfluss: 22,6 m³/s
| Date | Mean value [m³/s] | Maximum [m³/s] | Minimum [m³/s] |
|---|---|---|---|
| 22.05.2024 | 2.94 | 3.37 | 2.66 |
| 21.05.2024 | 1.63 | 2.61 | 1.34 |
| 20.05.2024 | 1.64 | 1.99 | 1.38 |
| 19.05.2024 | 1.69 | 2.04 | 1.42 |
| 18.05.2024 | 1.68 | 2.32 | 0.922 |
| 17.05.2024 | 1.31 | 1.63 | 0.785 |
| 16.05.2024 | 1.2 | 1.85 | 0.481 |
© Bayerisches Landesamt für Umwelt 2024