
- Start >
- Rivers >
- Discharge >
- Naab - Regen >
- Fronhof >
- Chart of year

Chart of year Fronhof / Murach
Discharge from 01.01.2024 to 31.12.2024
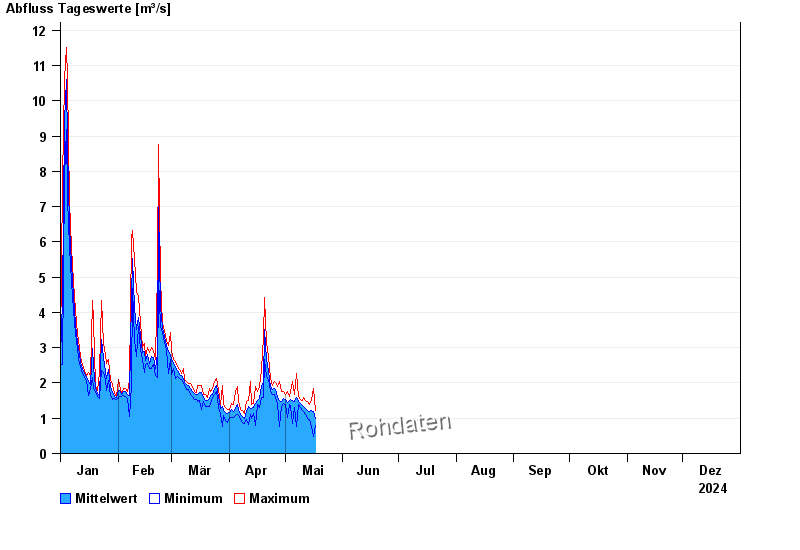
| Date | Mean value [m³/s] | Maximum [m³/s] | Minimum [m³/s] |
|---|---|---|---|
| 15.05.2024 | 1.29 | 1.3 | 1.26 |
| 14.05.2024 | 1.18 | 1.38 | 0.957 |
| 13.05.2024 | 1.23 | 1.46 | 0.993 |
| 12.05.2024 | 1.27 | 1.5 | 1.1 |
| 11.05.2024 | 1.34 | 1.59 | 1.18 |
| 10.05.2024 | 1.36 | 1.5 | 1.22 |
| 09.05.2024 | 1.41 | 1.54 | 1.3 |
© Bayerisches Landesamt für Umwelt 2024