
- Start >
- Rivers >
- Discharge >
- Naab - Regen >
- Fronhof >
- Chart of year

Chart of year Fronhof / Murach
Discharge from 01.01.2023 to 31.12.2023
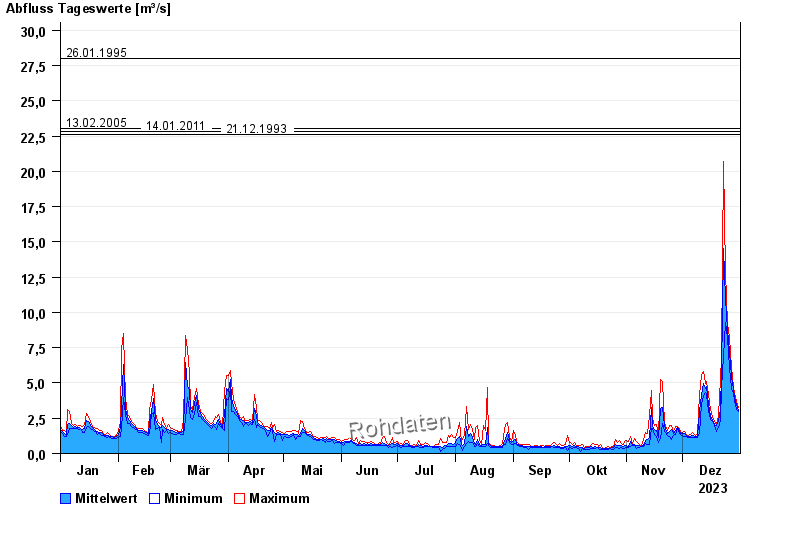
- 03.06.2013 Abfluss: 31,2 m³/s
- 26.01.1995 Abfluss: 28 m³/s
- 13.02.2005 Abfluss: 23 m³/s
- 14.01.2011 Abfluss: 22,8 m³/s
- 21.12.1993 Abfluss: 22,6 m³/s
| Date | Mean value [m³/s] | Maximum [m³/s] | Minimum [m³/s] |
|---|---|---|---|
| 31.12.2023 | 3.07 | 3.23 | 2.96 |
| 30.12.2023 | 3.45 | 3.72 | 3.12 |
| 29.12.2023 | 3.94 | 4.23 | 3.72 |
| 28.12.2023 | 4.53 | 4.69 | 4.23 |
| 27.12.2023 | 5.48 | 6.1 | 4.58 |
| 26.12.2023 | 7.26 | 8.21 | 6.1 |
| 25.12.2023 | 8.76 | 9.19 | 8.21 |
© Bayerisches Landesamt für Umwelt 2024