
- Start >
- Rivers >
- Discharge >
- Unterer Main >
- Birkenfeld >
- Chart of year

Chart of year Birkenfeld / Aisch
Discharge from 01.01.2020 to 31.12.2020
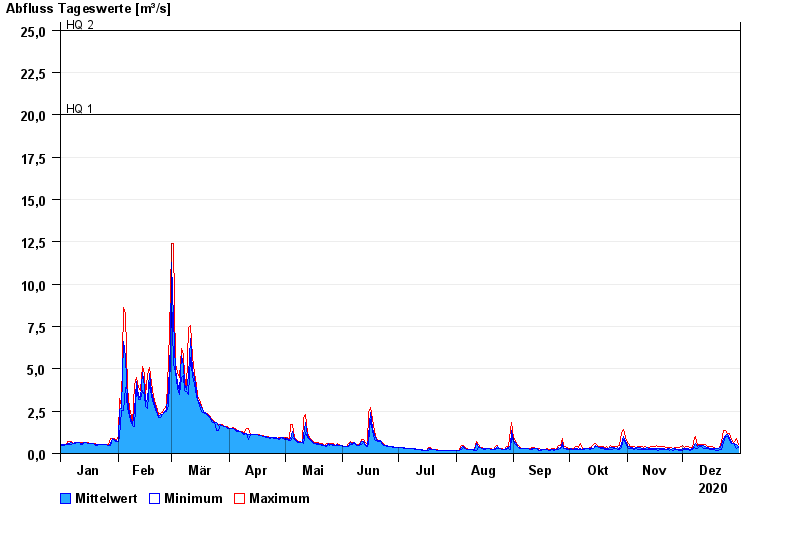
- HQ1 20 m³/s
- HQ2 25 m³/s
- HQ5 32 m³/s
- HQ10 40 m³/s
- HQ20 50 m³/s
- HQ50 65 m³/s
- HQ100 80 m³/s
| Date | Mean value [m³/s] | Maximum [m³/s] | Minimum [m³/s] |
|---|---|---|---|
| 31.12.2020 | 0.424 | 0.522 | 0.331 |
| 30.12.2020 | 0.522 | 0.896 | 0.298 |
| 29.12.2020 | 0.604 | 0.697 | 0.489 |
| 28.12.2020 | 0.589 | 0.603 | 0.589 |
| 27.12.2020 | 0.647 | 0.813 | 0.589 |
| 26.12.2020 | 0.887 | 1.17 | 0.773 |
| 25.12.2020 | 1.11 | 1.17 | 1.03 |
© Bayerisches Landesamt für Umwelt 2024