
- Start >
- Rivers >
- Discharge >
- Unterer Main >
- Birkenfeld >
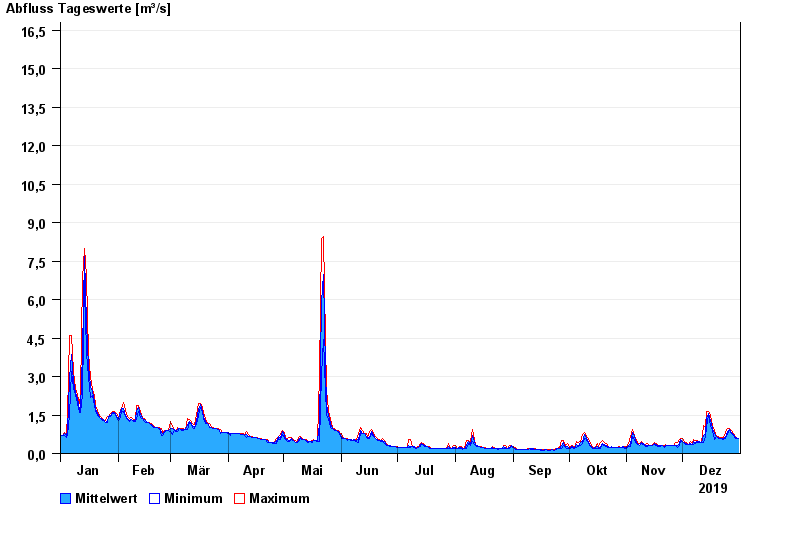
- Chart of year

Chart of year Birkenfeld / Aisch
Discharge from 01.01.2019 to 31.12.2019
- HQ1 20 m³/s
- HQ2 25 m³/s
- HQ5 32 m³/s
- HQ10 40 m³/s
- HQ20 50 m³/s
- HQ50 65 m³/s
- HQ100 80 m³/s
| Date | Mean value [m³/s] | Maximum [m³/s] | Minimum [m³/s] |
|---|---|---|---|
| 31.12.2019 | 0.594 | 0.596 | 0.593 |
| 30.12.2019 | 0.609 | 0.628 | 0.592 |
| 29.12.2019 | 0.659 | 0.702 | 0.626 |
| 28.12.2019 | 0.729 | 0.777 | 0.699 |
| 27.12.2019 | 0.814 | 0.9 | 0.776 |
| 26.12.2019 | 0.923 | 0.984 | 0.897 |
| 25.12.2019 | 0.861 | 0.984 | 0.768 |
© Bayerisches Landesamt für Umwelt 2024