
- Start >
- Rivers >
- Discharge >
- Unterer Main >
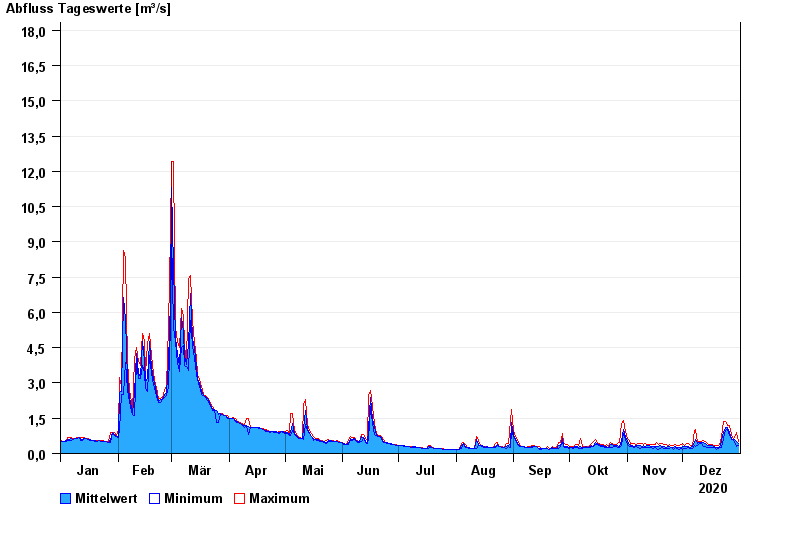
- Birkenfeld >
- Chart of year

Chart of year Birkenfeld / Aisch
Discharge from 01.01.2020 to 31.12.2020
- 09.07.2021 Abfluss: 83,7 m³/s
- 24.05.1978 Abfluss: 60 m³/s
- 30.10.1998 Abfluss: 45,1 m³/s
- 21.03.2002 Abfluss: 43,2 m³/s
- 08.01.2011 Abfluss: 39,3 m³/s
| Date | Mean value [m³/s] | Maximum [m³/s] | Minimum [m³/s] |
|---|---|---|---|
| 31.12.2020 | 0.424 | 0.522 | 0.331 |
| 30.12.2020 | 0.522 | 0.896 | 0.298 |
| 29.12.2020 | 0.604 | 0.697 | 0.489 |
| 28.12.2020 | 0.589 | 0.603 | 0.589 |
| 27.12.2020 | 0.647 | 0.813 | 0.589 |
| 26.12.2020 | 0.887 | 1.17 | 0.773 |
| 25.12.2020 | 1.11 | 1.17 | 1.03 |
© Bayerisches Landesamt für Umwelt 2024