
- Start >
- Rivers >
- Discharge >
- Unterer Main >
- Birkenfeld >
- Chart of year

Chart of year Birkenfeld / Aisch
Discharge from 01.01.2018 to 31.12.2018
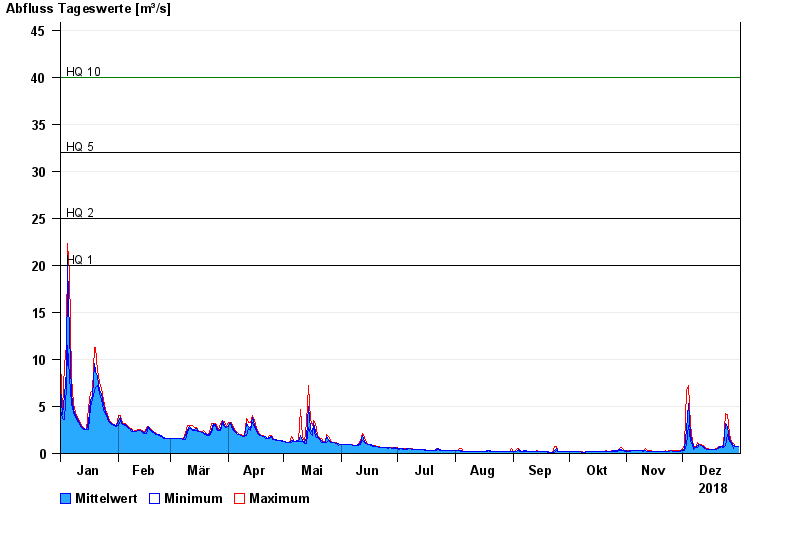
- HQ1 20 m³/s
- HQ2 25 m³/s
- HQ5 32 m³/s
- HQ10 40 m³/s
- HQ20 50 m³/s
- HQ50 65 m³/s
- HQ100 80 m³/s
| Date | Mean value [m³/s] | Maximum [m³/s] | Minimum [m³/s] |
|---|---|---|---|
| 31.12.2018 | 0.784 | 0.797 | 0.757 |
| 30.12.2018 | 0.796 | 0.796 | 0.795 |
| 29.12.2018 | 0.81 | 0.836 | 0.794 |
| 28.12.2018 | 0.853 | 1.01 | 0.531 |
| 27.12.2018 | 1.15 | 1.29 | 1.01 |
| 26.12.2018 | 1.54 | 1.97 | 1.29 |
| 25.12.2018 | 2.87 | 4.14 | 1.97 |
© Bayerisches Landesamt für Umwelt 2024