
- Start >
- Rivers >
- Discharge >
- Obere Donau >
- Freising >
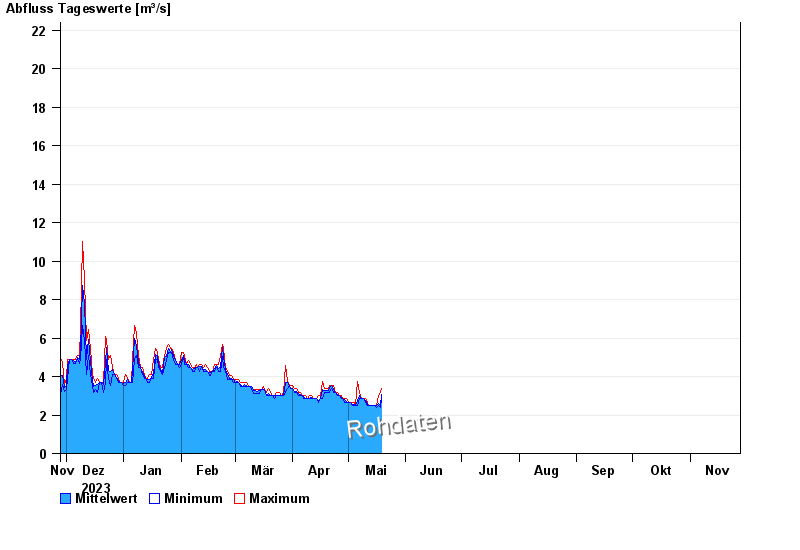
- Chart of year

Chart of year Freising / Moosach
Discharge from 28.11.2023 to 27.11.2024
 Für diesen Pegel sind keine Jährlichkeiten hinterlegt.
| Date | Mean value [m³/s] | Maximum [m³/s] | Minimum [m³/s] |
|---|---|---|---|
| 04.05.2024 | 2.53 | 2.67 | 2.52 |
| 03.05.2024 | 2.55 | 2.67 | 2.52 |
| 02.05.2024 | 2.67 | 2.67 | 2.67 |
| 01.05.2024 | 2.67 | 2.67 | 2.67 |
| 30.04.2024 | 2.69 | 2.84 | 2.67 |
| 29.04.2024 | 2.83 | 2.84 | 2.67 |
| 28.04.2024 | 2.84 | 2.84 | 2.84 |
© Bayerisches Landesamt für Umwelt 2024