
- Start >
- Rivers >
- Discharge >
- Obere Donau >
- Freising >
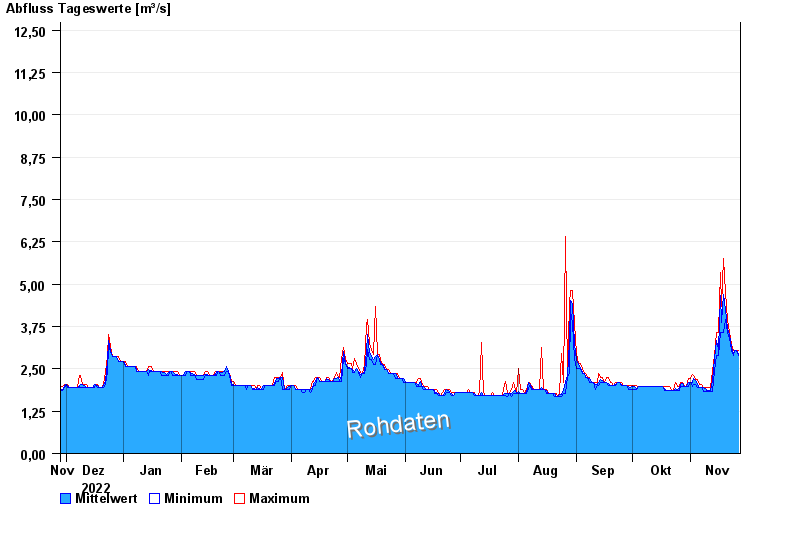
- Chart of year

Chart of year Freising / Moosach
Discharge from 28.11.2022 to 27.11.2023
 Für diesen Pegel sind keine Jährlichkeiten hinterlegt.
| Date | Mean value [m³/s] | Maximum [m³/s] | Minimum [m³/s] |
|---|---|---|---|
| 27.11.2023 | 2.95 | 3.05 | 2.89 |
| 26.11.2023 | 3.05 | 3.05 | 3.05 |
| 25.11.2023 | 3.05 | 3.05 | 3.05 |
| 24.11.2023 | 2.94 | 3.05 | 2.89 |
| 23.11.2023 | 3.14 | 3.22 | 3.05 |
| 22.11.2023 | 3.5 | 3.58 | 3.4 |
| 21.11.2023 | 3.69 | 3.96 | 3.58 |
© Bayerisches Landesamt für Umwelt 2024