
- Start >
- Rivers >
- Discharge >
- Obere Donau >
- Freising >
- Chart of year

Chart of year Freising / Moosach
Discharge from 28.11.2023 to 27.11.2024
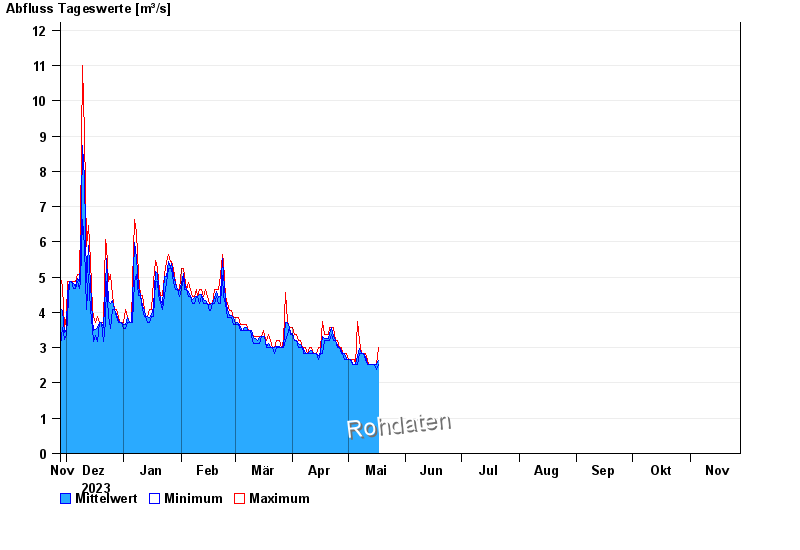
| Date | Mean value [m³/s] | Maximum [m³/s] | Minimum [m³/s] |
|---|---|---|---|
| 30.04.2024 | 2.67 | 2.67 | 2.67 |
| 29.04.2024 | 2.83 | 2.84 | 2.67 |
| 28.04.2024 | 2.84 | 2.84 | 2.84 |
| 27.04.2024 | 2.9 | 3.01 | 2.84 |
| 26.04.2024 | 3.01 | 3.01 | 3.01 |
| 25.04.2024 | 3.06 | 3.19 | 3.01 |
| 24.04.2024 | 3.19 | 3.19 | 3.19 |
© Bayerisches Landesamt für Umwelt 2024