
- Start >
- Rivers >
- Discharge >
- Obere Donau >
- Appolding >
- Chart of year

Chart of year Appolding / Strogen
Discharge from 27.01.2020 to 26.01.2021
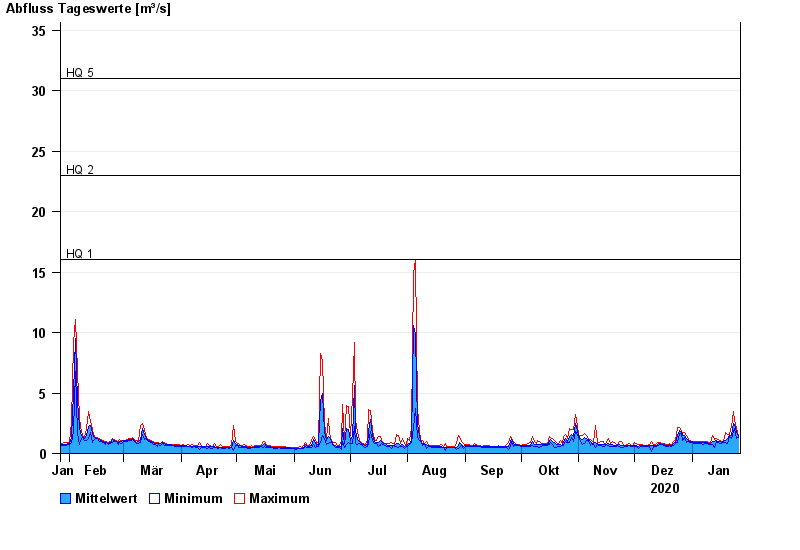
- HQ1 16 m³/s
- HQ2 23 m³/s
- HQ5 31 m³/s
- HQ10 38 m³/s
- HQ20 45 m³/s
- HQ50 57 m³/s
- HQ100 65 m³/s
| Date | Mean value [m³/s] | Maximum [m³/s] | Minimum [m³/s] |
|---|---|---|---|
| 26.01.2021 | 1.41 | 1.47 | 1.35 |
| 25.01.2021 | 1.7 | 2.07 | 1.22 |
| 24.01.2021 | 2.42 | 2.73 | 2.07 |
| 23.01.2021 | 2.5 | 3.49 | 1.85 |
| 22.01.2021 | 1.51 | 2.24 | 1.25 |
| 21.01.2021 | 1.47 | 1.54 | 1.41 |
| 20.01.2021 | 1.25 | 1.54 | 0.817 |
© Bayerisches Landesamt für Umwelt 2024