
- Start >
- Rivers >
- Discharge >
- Isar >
- Wasserburg >
- Chart of total period

Chart of total period Wasserburg / Inn
Discharge from 01.11.1964 to 26.04.2024
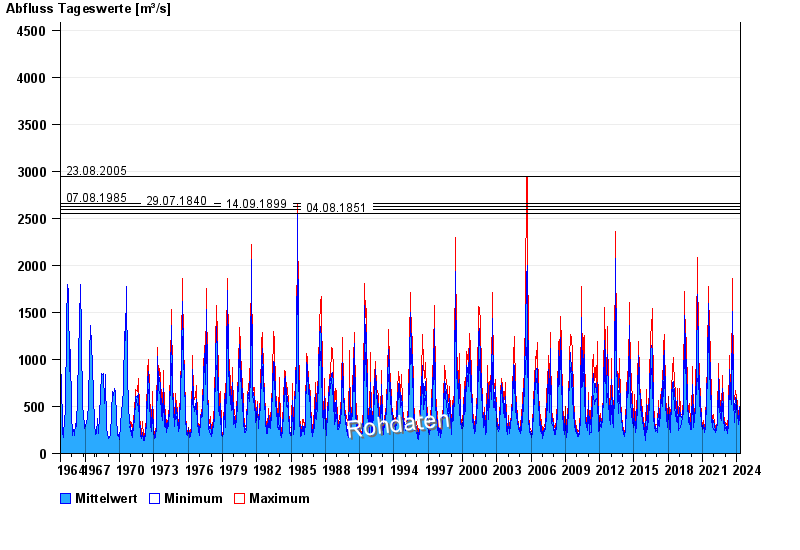
- 23.08.2005 Abfluss: 2940 m³/s
- 07.08.1985 Abfluss: 2660 m³/s
- 29.07.1840 Abfluss: 2630 m³/s
- 14.09.1899 Abfluss: 2590 m³/s
- 04.08.1851 Abfluss: 2550 m³/s
| Date | Mean value [m³/s] | Maximum [m³/s] | Minimum [m³/s] |
|---|---|---|---|
| 26.04.2024 | 299 | 299 | 299 |
| 25.04.2024 | 311 | 329 | 299 |
| 24.04.2024 | 330 | 353 | 310 |
| 23.04.2024 | 356 | 394 | 334 |
| 22.04.2024 | 338 | 368 | 319 |
| 21.04.2024 | 345 | 371 | 312 |
| 20.04.2024 | 376 | 389 | 363 |
© Bayerisches Landesamt für Umwelt 2024