
- Start >
- Rivers >
- Waterlevel >
- Isar >
- Wasserburg >
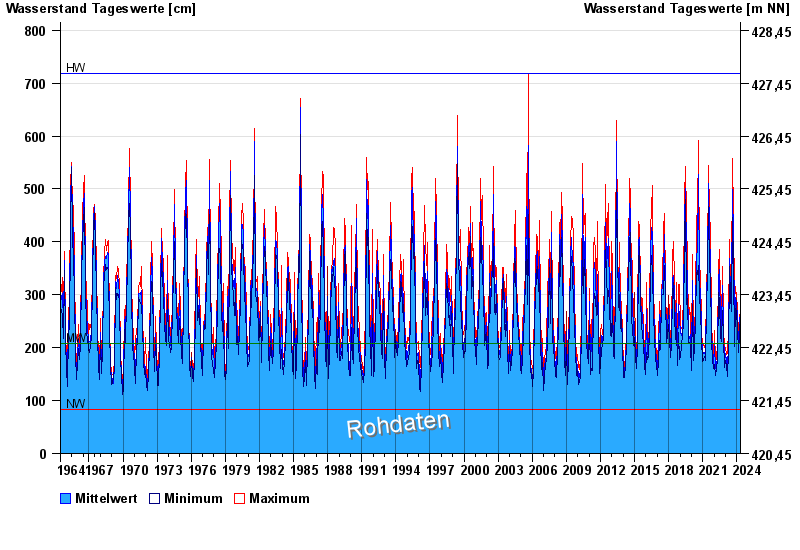
- Chart of total period

Chart of total period Wasserburg / Inn
Waterlevel from 01.07.1964 to 26.04.2024
| Date | Mean value [cm] | Maximum [cm] | Minimum [cm] |
|---|---|---|---|
| 26.04.2024 | 180 | 185 | 174 |
| 25.04.2024 | 189 | 197 | 184 |
| 24.04.2024 | 197 | 207 | 189 |
| 23.04.2024 | 208 | 223 | 199 |
| 22.04.2024 | 203 | 215 | 195 |
| 21.04.2024 | 206 | 216 | 192 |
| 20.04.2024 | 218 | 223 | 213 |
© Bayerisches Landesamt für Umwelt 2024