
- Start >
- Rivers >
- Discharge >
- Isar >
- Wasserburg >
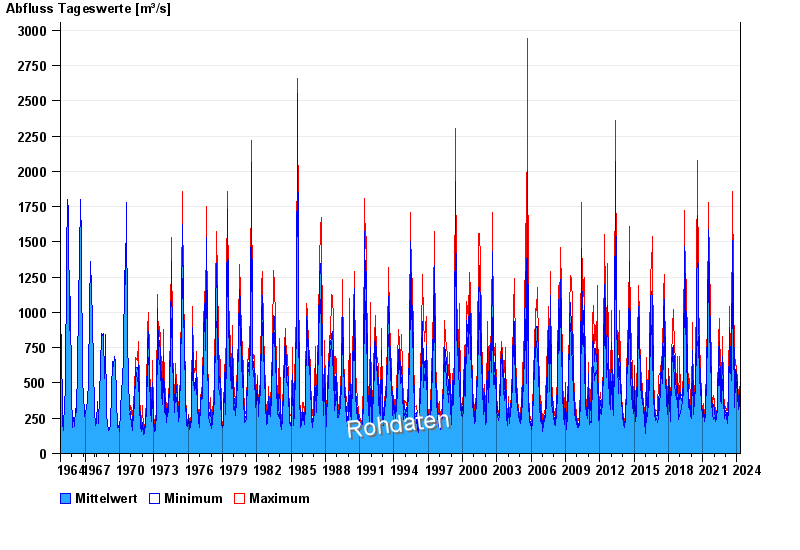
- Chart of total period

Chart of total period Wasserburg / Inn
Discharge from 01.11.1964 to 24.04.2024
| Date | Mean value [m³/s] | Maximum [m³/s] | Minimum [m³/s] |
|---|---|---|---|
| 24.04.2024 | 334 | 348 | 317 |
| 23.04.2024 | 351 | 389 | 328 |
| 22.04.2024 | 338 | 368 | 319 |
| 21.04.2024 | 345 | 371 | 312 |
| 20.04.2024 | 376 | 389 | 363 |
| 19.04.2024 | 399 | 435 | 365 |
| 18.04.2024 | 469 | 486 | 435 |
© Bayerisches Landesamt für Umwelt 2024