

Chart of total period Starnberg / Georgenbach
Discharge from 01.11.1978 to 26.04.2024
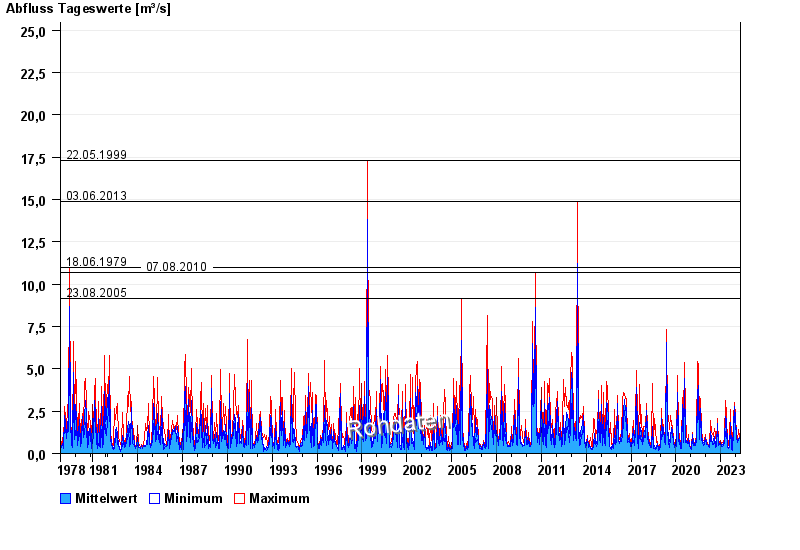
- 22.05.1999 Abfluss: 17,3 m³/s
- 03.06.2013 Abfluss: 14,9 m³/s
- 18.06.1979 Abfluss: 11 m³/s
- 07.08.2010 Abfluss: 10,7 m³/s
- 23.08.2005 Abfluss: 9,15 m³/s
| Date | Mean value [m³/s] | Maximum [m³/s] | Minimum [m³/s] |
|---|---|---|---|
| 26.04.2024 | 0.584 | 0.642 | 0.466 |
| 25.04.2024 | 0.615 | 0.71 | 0.579 |
| 24.04.2024 | 0.669 | 0.71 | 0.642 |
| 23.04.2024 | 0.71 | 0.71 | 0.71 |
| 22.04.2024 | 0.854 | 1.03 | 0.71 |
| 21.04.2024 | 0.929 | 1.03 | 0.864 |
| 20.04.2024 | 0.944 | 1.03 | 0.864 |
© Bayerisches Landesamt für Umwelt 2024