

Chart of total period Starnberg / Georgenbach
Discharge from 01.11.1978 to 24.04.2024
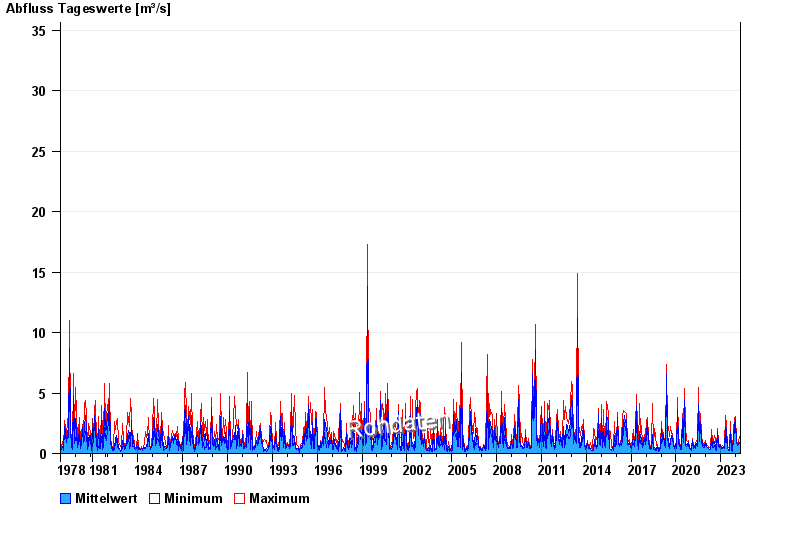 Für diesen Pegel sind keine Jährlichkeiten hinterlegt.
| Date | Mean value [m³/s] | Maximum [m³/s] | Minimum [m³/s] |
|---|---|---|---|
| 24.04.2024 | 0.71 | 0.71 | 0.71 |
| 23.04.2024 | 0.71 | 0.71 | 0.71 |
| 22.04.2024 | 0.854 | 1.03 | 0.71 |
| 21.04.2024 | 0.929 | 1.03 | 0.864 |
| 20.04.2024 | 0.944 | 1.03 | 0.864 |
| 19.04.2024 | 0.866 | 0.943 | 0.864 |
| 18.04.2024 | 0.875 | 0.943 | 0.781 |
© Bayerisches Landesamt für Umwelt 2024