

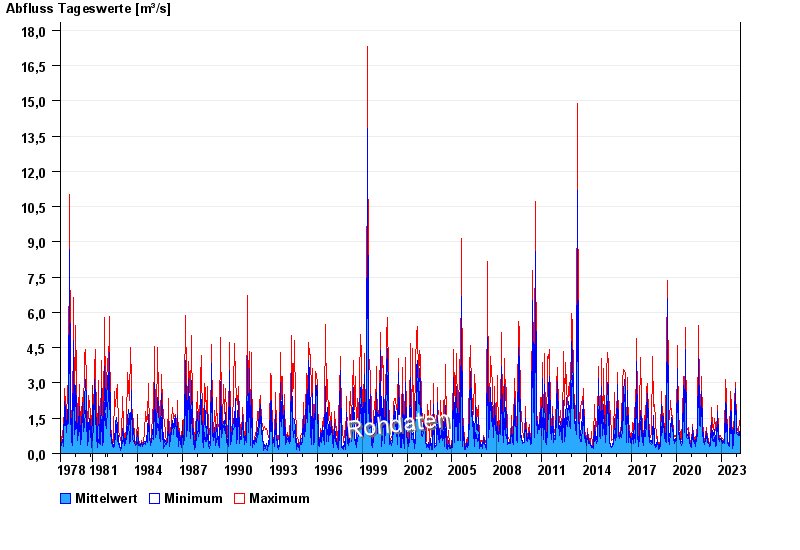
Chart of total period Starnberg / Georgenbach
Discharge from 01.11.1978 to 17.04.2024
| Date | Mean value [m³/s] | Maximum [m³/s] | Minimum [m³/s] |
|---|---|---|---|
| 17.04.2024 | 0.694 | 0.71 | 0.642 |
| 16.04.2024 | 0.663 | 0.71 | 0.579 |
| 15.04.2024 | 0.571 | 0.864 | 0.52 |
| 14.04.2024 | 0.502 | 0.579 | 0.466 |
| 13.04.2024 | 0.527 | 0.579 | 0.466 |
| 12.04.2024 | 0.563 | 0.642 | 0.466 |
| 11.04.2024 | 0.598 | 0.642 | 0.52 |
© Bayerisches Landesamt für Umwelt 2024