
- Start >
- Rivers >
- Discharge >
- Inn >
- Bad Wiessee >
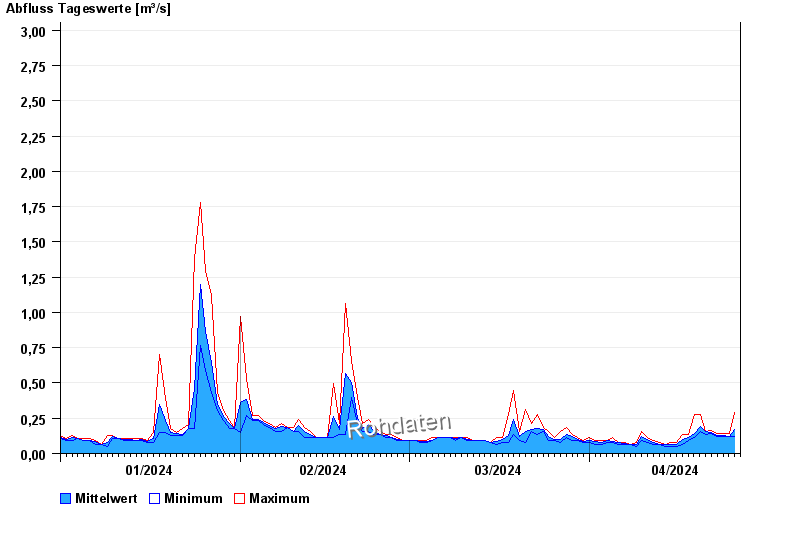
- Chart of year

Chart of year Bad Wiessee / Zeiselbach
Discharge from 01.01.2024 to 26.04.2024
- 10.06.1993 Abfluss: 16 m³/s
- 30.06.1990 Abfluss: 10,1 m³/s
- 13.06.2014 Abfluss: 9,54 m³/s
- 21.05.1999 Abfluss: 9,06 m³/s
- 02.06.2013 Abfluss: 8,89 m³/s
| Date | Mean value [m³/s] | Maximum [m³/s] | Minimum [m³/s] |
|---|---|---|---|
| 26.04.2024 | 0.153 | 0.277 | 0.113 |
| 25.04.2024 | 0.116 | 0.133 | 0.113 |
| 24.04.2024 | 0.118 | 0.133 | 0.113 |
| 23.04.2024 | 0.119 | 0.133 | 0.113 |
| 22.04.2024 | 0.139 | 0.156 | 0.133 |
| 21.04.2024 | 0.155 | 0.156 | 0.133 |
| 20.04.2024 | 0.194 | 0.277 | 0.156 |
© Bayerisches Landesamt für Umwelt 2024