
- Start >
- Rivers >
- Discharge >
- Inn >
- Bad Wiessee >
- Chart of year

Chart of year Bad Wiessee / Zeiselbach
Discharge from 01.01.2024 to 18.04.2024
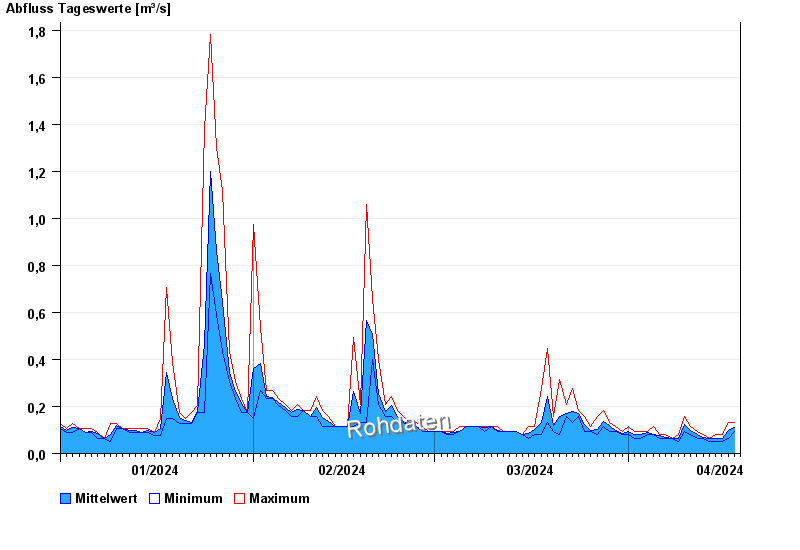
| Date | Mean value [m³/s] | Maximum [m³/s] | Minimum [m³/s] |
|---|---|---|---|
| 18.04.2024 | 0.105 | 0.113 | 0.095 |
| 17.04.2024 | 0.098 | 0.133 | 0.065 |
| 16.04.2024 | 0.066 | 0.079 | 0.053 |
| 15.04.2024 | 0.064 | 0.079 | 0.053 |
| 14.04.2024 | 0.065 | 0.065 | 0.053 |
| 13.04.2024 | 0.066 | 0.079 | 0.065 |
| 12.04.2024 | 0.08 | 0.095 | 0.065 |
© Bayerisches Landesamt für Umwelt 2024