
- Start >
- Rivers >
- Discharge >
- Inn >
- Bad Wiessee >
- Chart of year

Chart of year Bad Wiessee / Zeiselbach
Discharge from 01.01.2024 to 25.04.2024
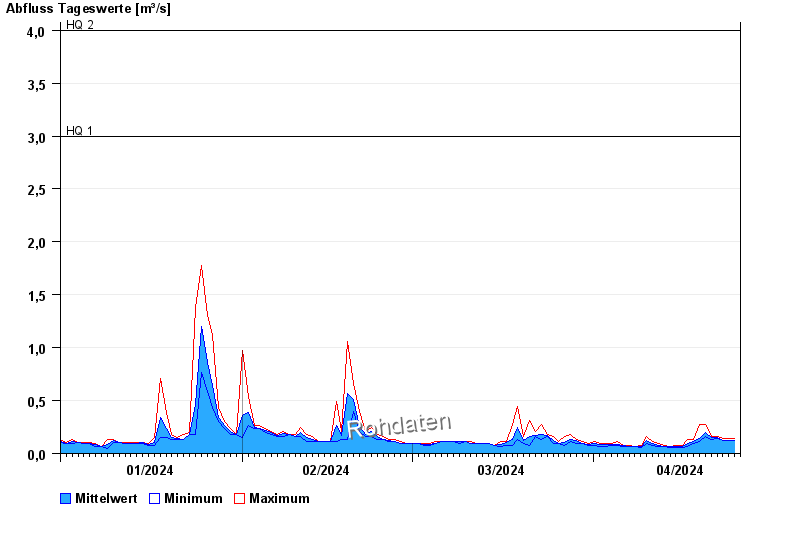
- HQ1 3 m³/s
- HQ2 4 m³/s
- HQ5 6,6 m³/s
- HQ10 9,7 m³/s
- HQ20 13 m³/s
- HQ50 17 m³/s
- HQ100 20 m³/s
| Date | Mean value [m³/s] | Maximum [m³/s] | Minimum [m³/s] |
|---|---|---|---|
| 25.04.2024 | 0.114 | 0.133 | 0.113 |
| 24.04.2024 | 0.118 | 0.133 | 0.113 |
| 23.04.2024 | 0.119 | 0.133 | 0.113 |
| 22.04.2024 | 0.139 | 0.156 | 0.133 |
| 21.04.2024 | 0.155 | 0.156 | 0.133 |
| 20.04.2024 | 0.194 | 0.277 | 0.156 |
| 19.04.2024 | 0.142 | 0.277 | 0.113 |
© Bayerisches Landesamt für Umwelt 2024