
- Start >
- Rivers >
- Discharge >
- Iller - Lech - Bodensee >
- Stielings >
- Chart of year

Chart of year Stielings / Leubas
Discharge from 02.08.2021 to 01.08.2022
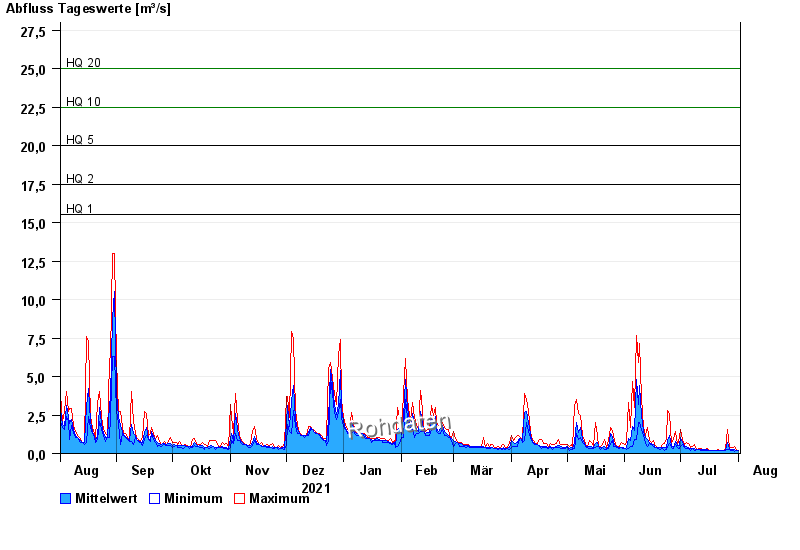
- HQ1 15,5 m³/s
- HQ2 17,5 m³/s
- HQ5 20 m³/s
- HQ10 22,5 m³/s
- HQ20 25 m³/s
- HQ50 28 m³/s
- HQ100 30 m³/s
| Date | Mean value [m³/s] | Maximum [m³/s] | Minimum [m³/s] |
|---|---|---|---|
| 01.08.2022 | 0.199 | 0.227 | 0.196 |
| 31.07.2022 | 0.209 | 0.227 | 0.196 |
| 30.07.2022 | 0.243 | 0.479 | 0.124 |
| 29.07.2022 | 0.279 | 0.414 | 0.196 |
| 28.07.2022 | 0.268 | 0.414 | 0.227 |
| 27.07.2022 | 0.316 | 0.414 | 0.264 |
| 26.07.2022 | 0.694 | 1.56 | 0.264 |
© Bayerisches Landesamt für Umwelt 2024