
- Start >
- Rivers >
- Discharge >
- Iller - Lech - Bodensee >
- Stielings >
- Chart of year

Chart of year Stielings / Leubas
Discharge from 02.08.2020 to 01.08.2021
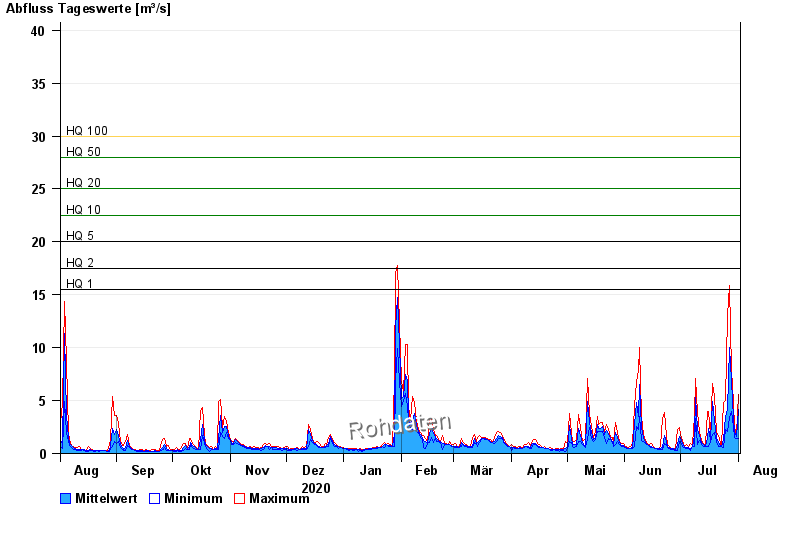
- HQ1 15,5 m³/s
- HQ2 17,5 m³/s
- HQ5 20 m³/s
- HQ10 22,5 m³/s
- HQ20 25 m³/s
- HQ50 28 m³/s
- HQ100 30 m³/s
| Date | Mean value [m³/s] | Maximum [m³/s] | Minimum [m³/s] |
|---|---|---|---|
| 01.08.2021 | 4.15 | 5.62 | 1.4 |
| 31.07.2021 | 1.63 | 1.81 | 1.4 |
| 30.07.2021 | 2.04 | 2.42 | 1.53 |
| 29.07.2021 | 3.32 | 4.79 | 2.42 |
| 28.07.2021 | 6.94 | 7.84 | 4.01 |
| 27.07.2021 | 9.97 | 15.9 | 3.44 |
| 26.07.2021 | 4.19 | 13 | 2.11 |
© Bayerisches Landesamt für Umwelt 2024