
- Start >
- Rivers >
- Discharge >
- Iller - Lech - Bodensee >
- Stielings >
- Chart of year

Chart of year Stielings / Leubas
Discharge from 02.08.2022 to 01.08.2023
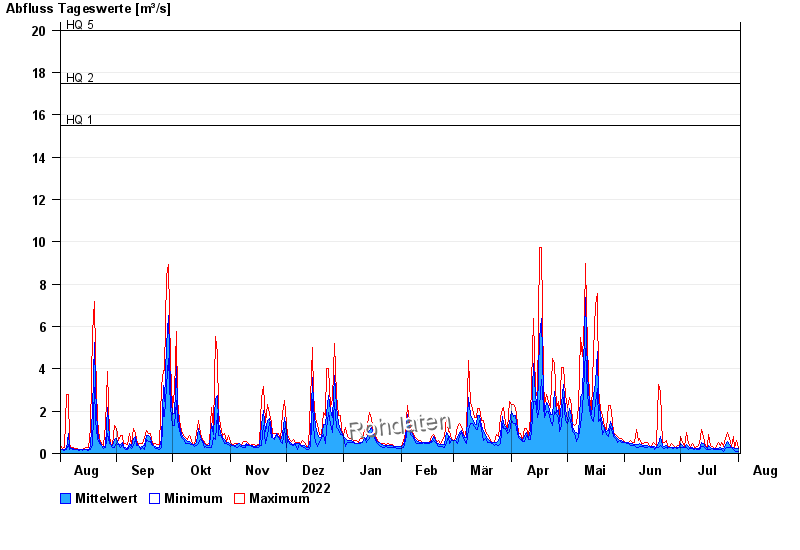
- HQ1 15,5 m³/s
- HQ2 17,5 m³/s
- HQ5 20 m³/s
- HQ10 22,5 m³/s
- HQ20 25 m³/s
- HQ50 28 m³/s
- HQ100 30 m³/s
| Date | Mean value [m³/s] | Maximum [m³/s] | Minimum [m³/s] |
|---|---|---|---|
| 01.08.2023 | 0.236 | 0.302 | 0.118 |
| 31.07.2023 | 0.237 | 0.607 | 0.118 |
| 30.07.2023 | 0.255 | 0.302 | 0.142 |
| 29.07.2023 | 0.3 | 0.79 | 0.168 |
| 28.07.2023 | 0.307 | 0.347 | 0.302 |
| 27.07.2023 | 0.441 | 0.693 | 0.302 |
| 26.07.2023 | 0.569 | 1.01 | 0.302 |
© Bayerisches Landesamt für Umwelt 2024