
- Start >
- Rivers >
- Discharge >
- Bayern >
- Heinersdorf >
- Chart of year

Chart of year Heinersdorf / Rodach
Discharge from 01.01.2020 to 31.12.2020
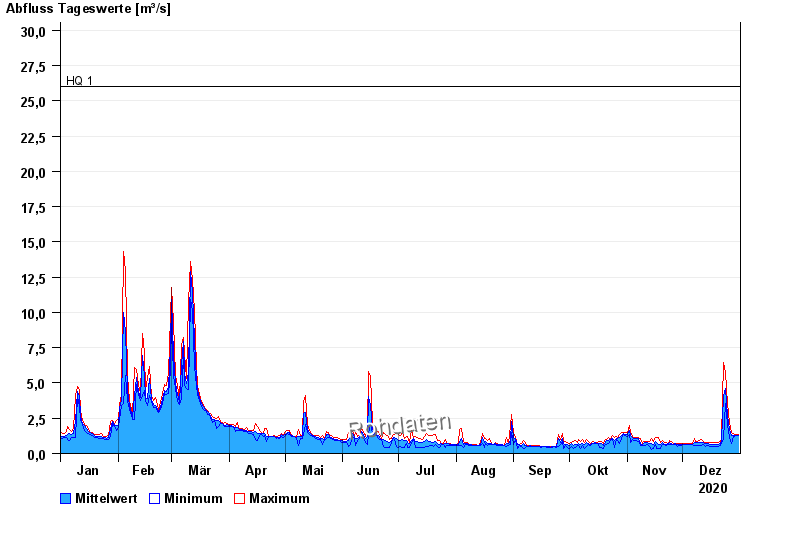
- HQ1 26 m³/s
- HQ2 35 m³/s
- HQ5 45 m³/s
- HQ10 55 m³/s
- HQ20 66 m³/s
- HQ50 80 m³/s
- HQ100 95 m³/s
| Date | Mean value [m³/s] | Maximum [m³/s] | Minimum [m³/s] |
|---|---|---|---|
| 31.12.2020 | 1.29 | 1.32 | 1.23 |
| 30.12.2020 | 1.28 | 1.32 | 1.23 |
| 29.12.2020 | 1.25 | 1.28 | 1.19 |
| 28.12.2020 | 1.2 | 1.37 | 1.19 |
| 27.12.2020 | 1.27 | 1.47 | 0.73 |
| 26.12.2020 | 1.68 | 2.19 | 1.14 |
| 25.12.2020 | 2.64 | 3.49 | 2.01 |
© Bayerisches Landesamt für Umwelt 2025