
- Start >
- Rivers >
- Discharge >
- Bayern >
- Heinersdorf >
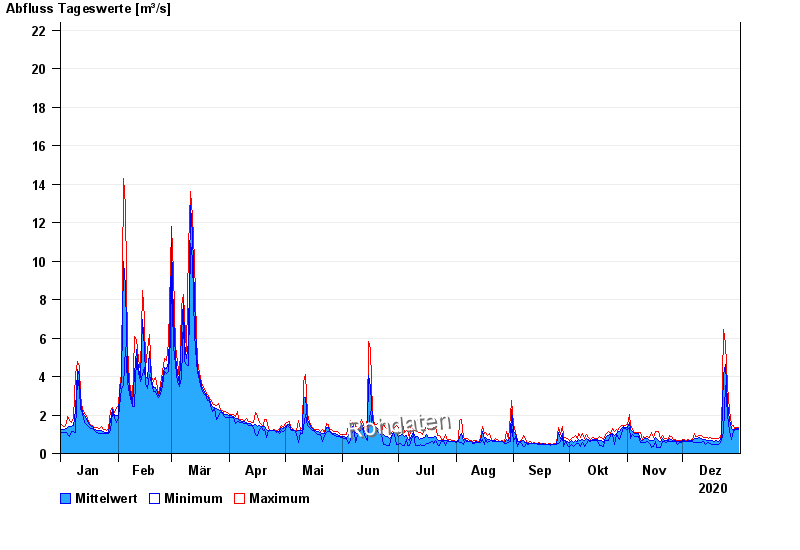
- Chart of year

Chart of year Heinersdorf / Rodach
Discharge from 01.01.2020 to 31.12.2020
- 03.01.2003 Abfluss: 86,6 m³/s
- 24.12.1967 Abfluss: 73,2 m³/s
- 08.05.2004 Abfluss: 68,3 m³/s
- 23.02.1970 Abfluss: 67,9 m³/s
- 14.01.2011 Abfluss: 67,6 m³/s
| Date | Mean value [m³/s] | Maximum [m³/s] | Minimum [m³/s] |
|---|---|---|---|
| 31.12.2020 | 1.3 | 1.34 | 1.25 |
| 30.12.2020 | 1.3 | 1.34 | 1.25 |
| 29.12.2020 | 1.27 | 1.29 | 1.21 |
| 28.12.2020 | 1.26 | 1.44 | 1.21 |
| 27.12.2020 | 1.3 | 1.49 | 0.742 |
| 26.12.2020 | 1.71 | 2.21 | 1.16 |
| 25.12.2020 | 2.67 | 3.51 | 2.03 |
© Bayerisches Landesamt für Umwelt 2024