
- Start >
- Rivers >
- Discharge >
- Bayern >
- Heinersdorf >
- Chart of year

Chart of year Heinersdorf / Rodach
Discharge from 01.01.2021 to 31.12.2021
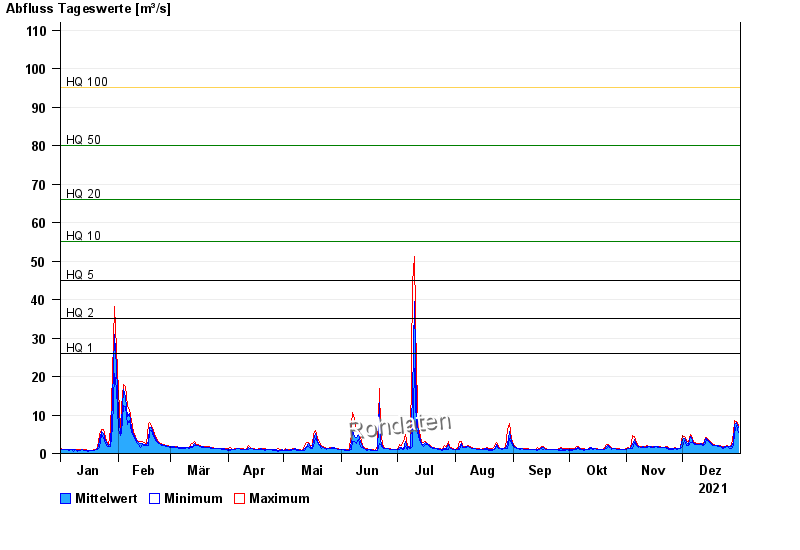
- HQ1 26 m³/s
- HQ2 35 m³/s
- HQ5 45 m³/s
- HQ10 55 m³/s
- HQ20 66 m³/s
- HQ50 80 m³/s
- HQ100 95 m³/s
| Date | Mean value [m³/s] | Maximum [m³/s] | Minimum [m³/s] |
|---|---|---|---|
| 31.12.2021 | 6.81 | 7.55 | 5.71 |
| 30.12.2021 | 8.09 | 8.6 | 7.55 |
| 29.12.2021 | 7.65 | 8.77 | 5.4 |
| 28.12.2021 | 3.28 | 5.4 | 2.2 |
| 27.12.2021 | 1.87 | 2.2 | 1.48 |
| 26.12.2021 | 1.81 | 2.01 | 1.24 |
| 25.12.2021 | 2 | 2.13 | 1.84 |
© Bayerisches Landesamt für Umwelt 2025