
- Start >
- Meteorology >
- Air temperature >
- Iller - Lech - Bodensee >
- Schwand >
- Chart of total period

Chart of total period Schwand
Air temperatur from 16.03.2011 to 02.05.2024
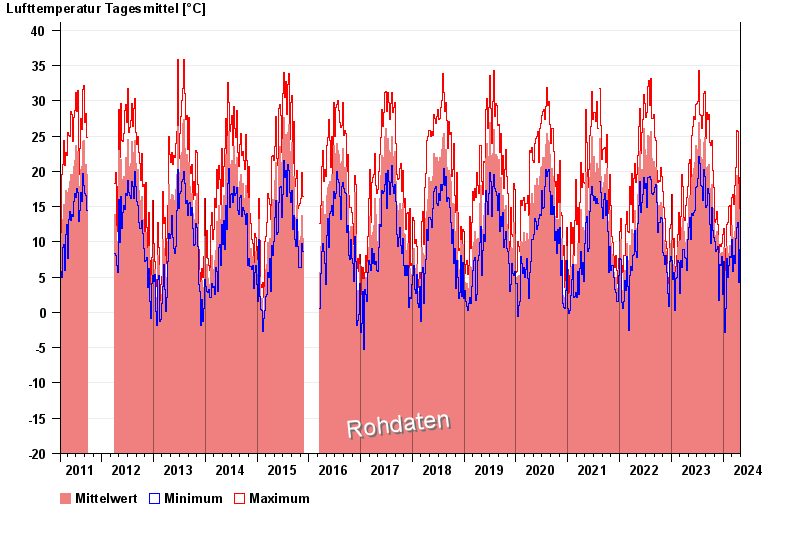
Note: The time series in the selected period has gaps.
| Date | Mean value [°C] | Maximum [°C] | Minimum [°C] |
|---|---|---|---|
| 02.05.2024 | 17.3 | 17.4 | 17.1 |
| 01.05.2024 | 19.2 | 26.3 | 10.9 |
| 30.04.2024 | 17.2 | 25.8 | 11.2 |
| 29.04.2024 | 11.9 | 19.1 | 4.9 |
| 28.04.2024 | 14.6 | 17.8 | 8.9 |
| 27.04.2024 | 11.3 | 19.1 | 0.9 |
| 26.04.2024 | 8.1 | 14.1 | 4.5 |
© Bayerisches Landesamt für Umwelt 2024