
- Start >
- Meteorology >
- Air moisture >
- Iller - Lech - Bodensee >
- Schwand >
- Chart of total period

Chart of total period Schwand
Air moisture from 16.03.2011 to 24.04.2024
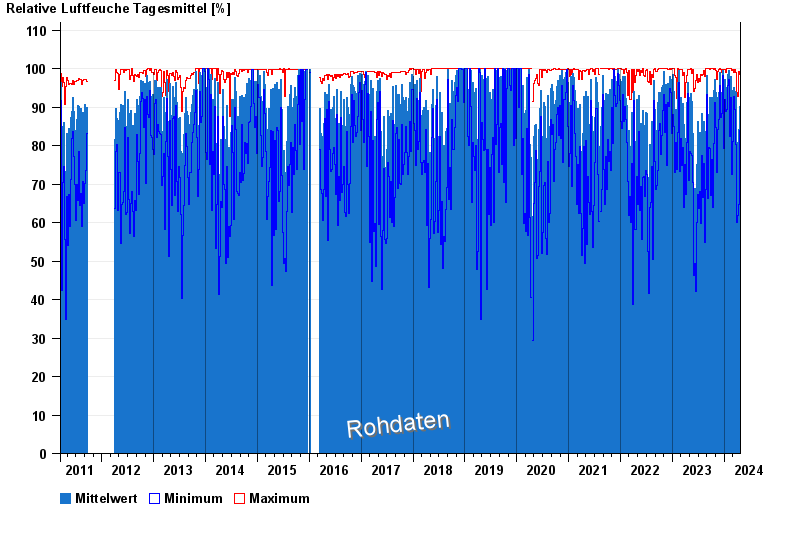
Note: The time series in the selected period has gaps.
| Date | Mean value [%] | Maximum [%] | Minimum [%] |
|---|---|---|---|
| 24.04.2024 | 79.3 | 90.2 | 61.5 |
| 23.04.2024 | 80.6 | 91.1 | 72.7 |
| 22.04.2024 | 83.9 | 98.6 | 71.0 |
| 21.04.2024 | 90.3 | 97.5 | 84.0 |
| 20.04.2024 | 85.0 | 95.7 | 71.0 |
| 19.04.2024 | 82.3 | 95.3 | 61.4 |
| 18.04.2024 | 89.8 | 98.4 | 73.8 |
© Bayerisches Landesamt für Umwelt 2024