
- Start >
- Meteorology >
- Global radiation >
- Iller - Lech - Bodensee >
- Schwand >
- Chart of total period

Chart of total period Schwand
Global radiation from 01.01.2018 to 06.02.2023
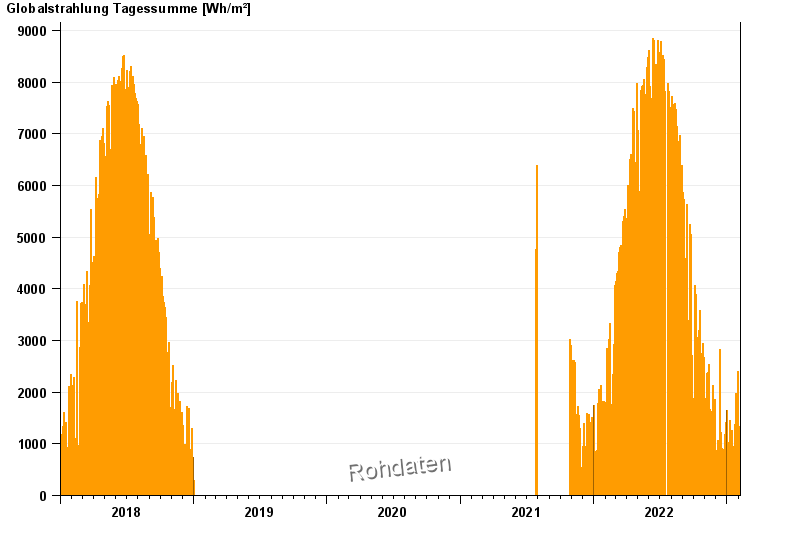
Note: The time series in the selected period has gaps.
| Date | Global radiation [Wh/m²] |
|---|---|
| 06.02.2023 | 8.3 |
| 05.02.2023 | 915.4 |
| 04.02.2023 | 715.3 |
| 03.02.2023 | 1343.9 |
| 02.02.2023 | 204.7 |
| 01.02.2023 | 531.9 |
| 31.01.2023 | 1830.5 |
© Bayerisches Landesamt für Umwelt 2025