
- Start >
- Rivers >
- Waterlevel >
- Regnitz >
- Trunstadt >
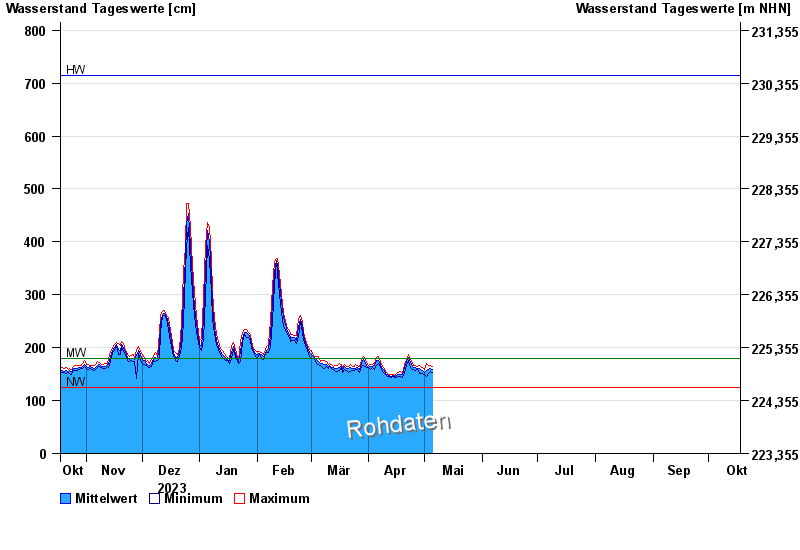
- Chart of year

Chart of year Trunstadt / Main
Waterlevel from 18.10.2023 to 17.10.2024
| Date | Mean value [cm] | Maximum [cm] | Minimum [cm] |
|---|---|---|---|
| 09.06.2024 | 166 | 169 | 164 |
| 08.06.2024 | 176 | 186 | 169 |
| 07.06.2024 | 198 | 210 | 182 |
| 06.06.2024 | 222 | 233 | 208 |
| 05.06.2024 | 251 | 276 | 231 |
| 04.06.2024 | 299 | 313 | 277 |
| 03.06.2024 | 302 | 317 | 274 |
© Bayerisches Landesamt für Umwelt 2024