
- Start >
- Rivers >
- Waterlevel >
- Regnitz >
- Trunstadt >
- Chart of year

Chart of year Trunstadt / Main
Waterlevel from 18.10.2023 to 17.10.2024
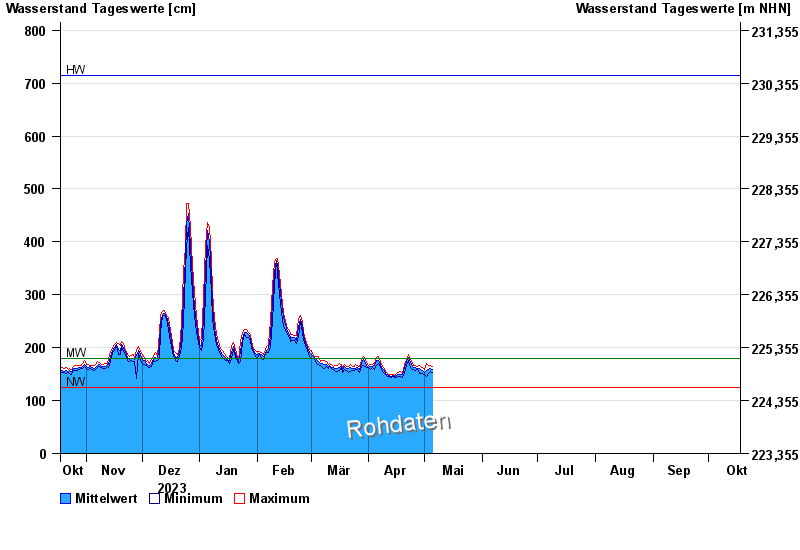
| Date | Mean value [cm] | Maximum [cm] | Minimum [cm] |
|---|---|---|---|
| 04.05.2024 | 163 | 167 | 156 |
| 03.05.2024 | 158 | 166 | 152 |
| 02.05.2024 | 156 | 171 | 145 |
| 01.05.2024 | 153 | 159 | 150 |
| 30.04.2024 | 157 | 162 | 152 |
| 29.04.2024 | 157 | 163 | 152 |
| 28.04.2024 | 160 | 166 | 152 |
© Bayerisches Landesamt für Umwelt 2024