
- Start >
- Rivers >
- Waterlevel >
- Regnitz >
- Roth Bleiche >
- Chart of total period

Chart of total period Roth Bleiche / Roth
Waterlevel from 13.05.1968 to 26.04.2024
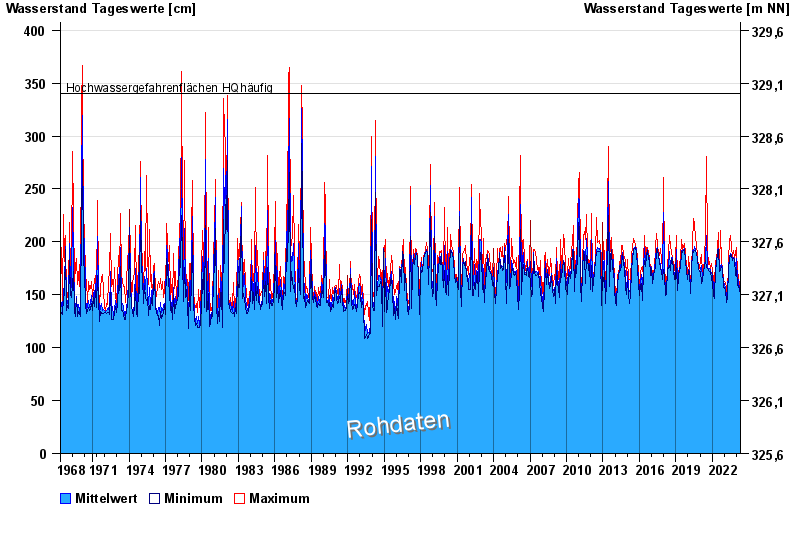
- Hochwassergefahrenfläche HQhäufig 340 cm
- Hochwassergefahrenfläche HQ100 410 cm
| Date | Mean value [cm] | Maximum [cm] | Minimum [cm] |
|---|---|---|---|
| 26.04.2024 | 139 | 140 | 138 |
| 25.04.2024 | 140 | 141 | 139 |
| 24.04.2024 | 141 | 141 | 140 |
| 23.04.2024 | 141 | 142 | 139 |
| 22.04.2024 | 143 | 145 | 140 |
| 21.04.2024 | 143 | 145 | 141 |
| 20.04.2024 | 143 | 145 | 140 |
© Bayerisches Landesamt für Umwelt 2024