
- Start >
- Rivers >
- Waterlevel >
- Regnitz >
- Roth Bleiche >
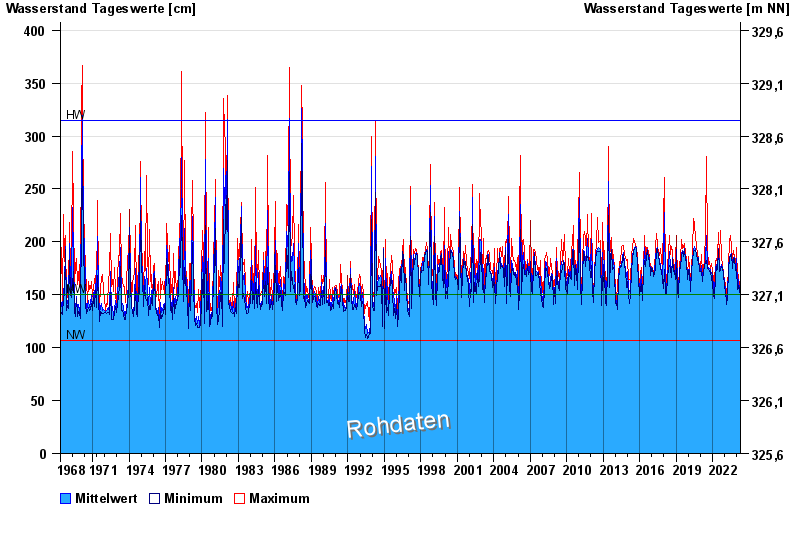
- Chart of total period

Chart of total period Roth Bleiche / Roth
Waterlevel from 13.05.1968 to 19.04.2024
| Date | Mean value [cm] | Maximum [cm] | Minimum [cm] |
|---|---|---|---|
| 19.04.2024 | 140 | 147 | 139 |
| 18.04.2024 | 140 | 141 | 138 |
| 17.04.2024 | 141 | 143 | 140 |
| 16.04.2024 | 140 | 145 | 139 |
| 15.04.2024 | 157 | 165 | 141 |
| 14.04.2024 | 163 | 163 | 160 |
| 13.04.2024 | 163 | 164 | 162 |
© Bayerisches Landesamt für Umwelt 2024