
- Start >
- Rivers >
- Waterlevel >
- Regnitz >
- Lauf >
- Chart of year

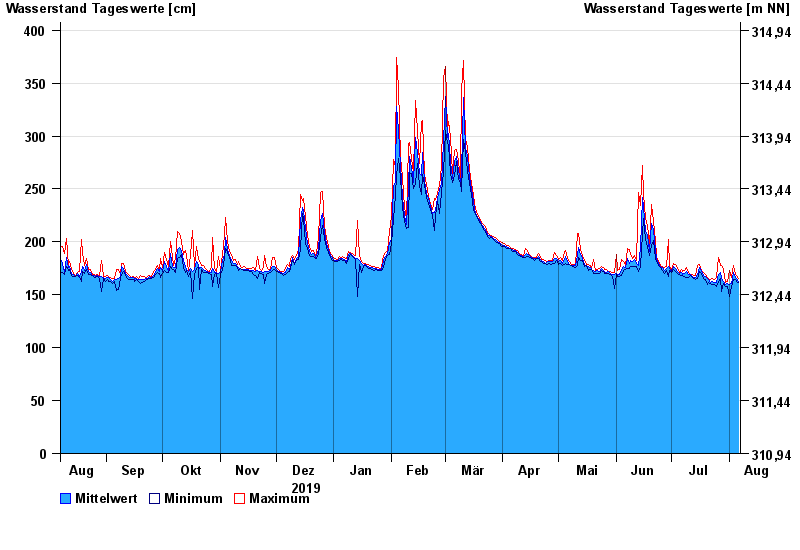
Chart of year Lauf / Pegnitz
Waterlevel from 07.08.2019 to 06.08.2020
| Date | Mean value [cm] | Maximum [cm] | Minimum [cm] |
|---|---|---|---|
| 06.08.2020 | 163 | 165 | 162 |
| 05.08.2020 | 165 | 168 | 163 |
| 04.08.2020 | 166 | 169 | 164 |
| 03.08.2020 | 171 | 178 | 164 |
| 02.08.2020 | 161 | 166 | 158 |
| 01.08.2020 | 160 | 173 | 148 |
| 31.07.2020 | 161 | 163 | 158 |
© Bayerisches Landesamt für Umwelt 2024