
- Start >
- Rivers >
- Waterlevel >
- Regnitz >
- Lauf >
- Chart of year

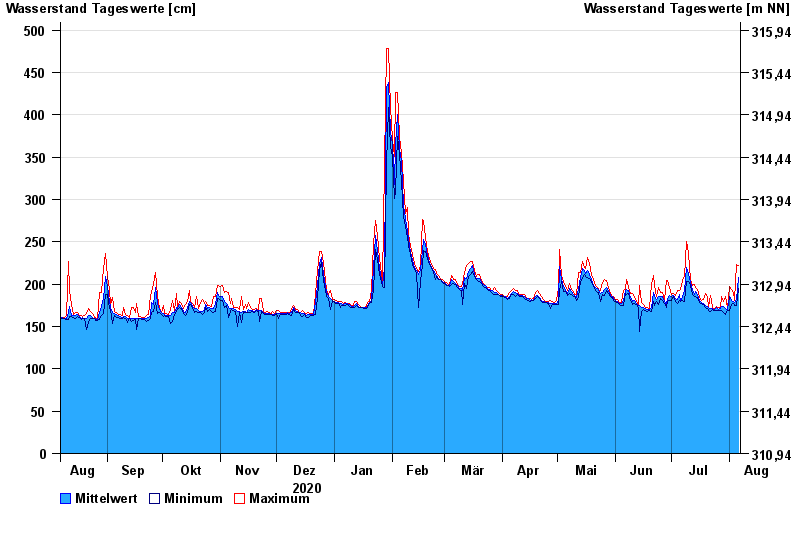
Chart of year Lauf / Pegnitz
Waterlevel from 07.08.2020 to 06.08.2021
| Date | Mean value [cm] | Maximum [cm] | Minimum [cm] |
|---|---|---|---|
| 06.08.2021 | 208 | 222 | 195 |
| 05.08.2021 | 182 | 223 | 175 |
| 04.08.2021 | 178 | 181 | 175 |
| 03.08.2021 | 180 | 190 | 177 |
| 02.08.2021 | 181 | 194 | 176 |
| 01.08.2021 | 186 | 197 | 169 |
| 31.07.2021 | 170 | 171 | 169 |
© Bayerisches Landesamt für Umwelt 2024