
- Start >
- Rivers >
- Waterlevel >
- Regnitz >
- Lauf >
- Chart of year

Chart of year Lauf / Pegnitz
Waterlevel from 30.03.2024 to 29.03.2025
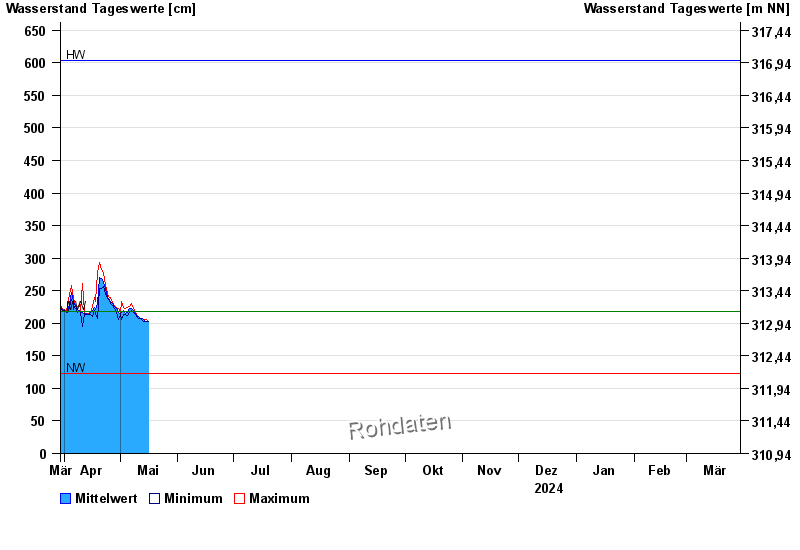
| Date | Mean value [cm] | Maximum [cm] | Minimum [cm] |
|---|---|---|---|
| 29.04.2024 | 223 | 224 | 223 |
| 28.04.2024 | 225 | 228 | 223 |
| 27.04.2024 | 230 | 232 | 228 |
| 26.04.2024 | 234 | 239 | 231 |
| 25.04.2024 | 238 | 241 | 236 |
| 24.04.2024 | 239 | 246 | 238 |
| 23.04.2024 | 253 | 258 | 246 |
© Bayerisches Landesamt für Umwelt 2024