
- Start >
- Rivers >
- Waterlevel >
- Regnitz >
- Lauf >
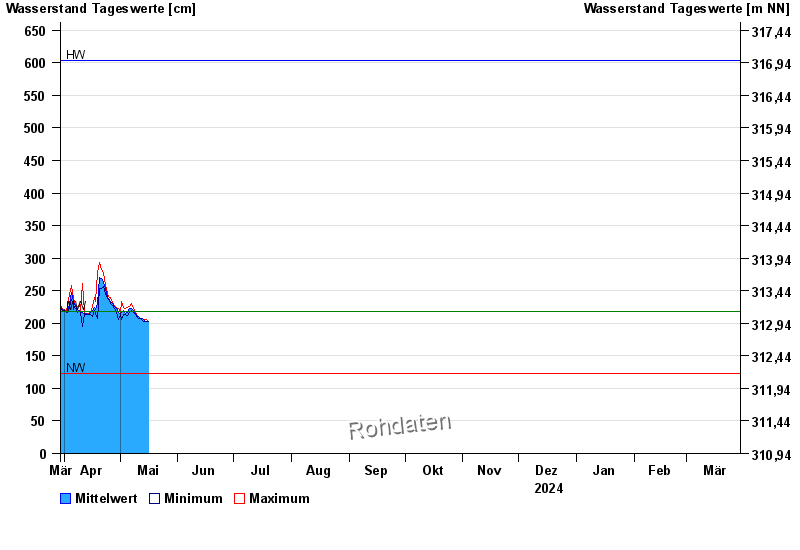
- Chart of year

Chart of year Lauf / Pegnitz
Waterlevel from 30.03.2024 to 29.03.2025
| Date | Mean value [cm] | Maximum [cm] | Minimum [cm] |
|---|---|---|---|
| 15.05.2024 | 203 | 204 | 203 |
| 14.05.2024 | 204 | 205 | 203 |
| 13.05.2024 | 207 | 208 | 204 |
| 12.05.2024 | 208 | 208 | 207 |
| 11.05.2024 | 210 | 211 | 208 |
| 10.05.2024 | 212 | 213 | 210 |
| 09.05.2024 | 215 | 217 | 213 |
© Bayerisches Landesamt für Umwelt 2024