
- Start >
- Rivers >
- Waterlevel >
- Untere Donau >
- Rötz Speicherzufluss >
- Chart of total period

Chart of total period Rötz Speicherzufluss / Schwarzach
Waterlevel from 01.11.1971 to 03.05.2024
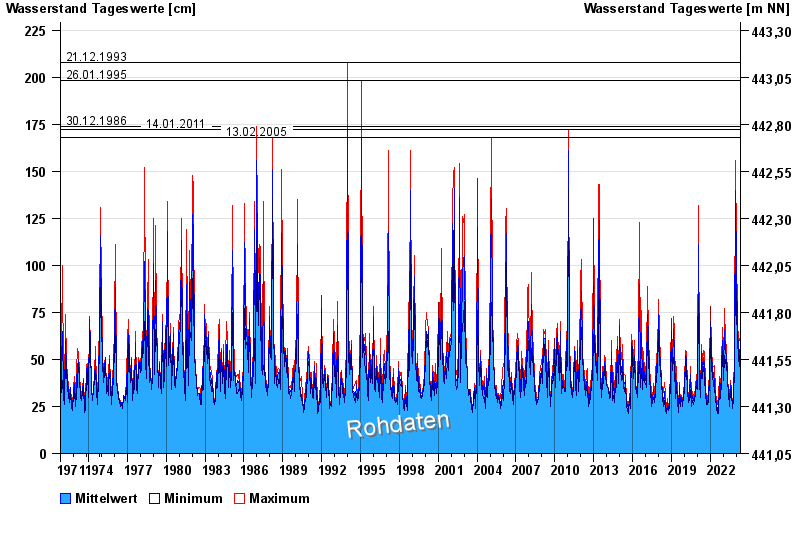
- 21.12.1993 Wasserstand: 208 cm
- 26.01.1995 Wasserstand: 198 cm
- 30.12.1986 Wasserstand: 174 cm
- 14.01.2011 Wasserstand: 172 cm
- 13.02.2005 Wasserstand: 168 cm
| Date | Mean value [cm] | Maximum [cm] | Minimum [cm] |
|---|---|---|---|
| 03.05.2024 | 31 | 31 | 31 |
| 02.05.2024 | 31 | 32 | 30 |
| 01.05.2024 | 31 | 32 | 31 |
| 30.04.2024 | 32 | 33 | 31 |
| 29.04.2024 | 33 | 34 | 33 |
| 28.04.2024 | 34 | 35 | 33 |
| 27.04.2024 | 35 | 36 | 34 |
© Bayerisches Landesamt für Umwelt 2024