
- Start >
- Rivers >
- Waterlevel >
- Untere Donau >
- Rötz Speicherzufluss >
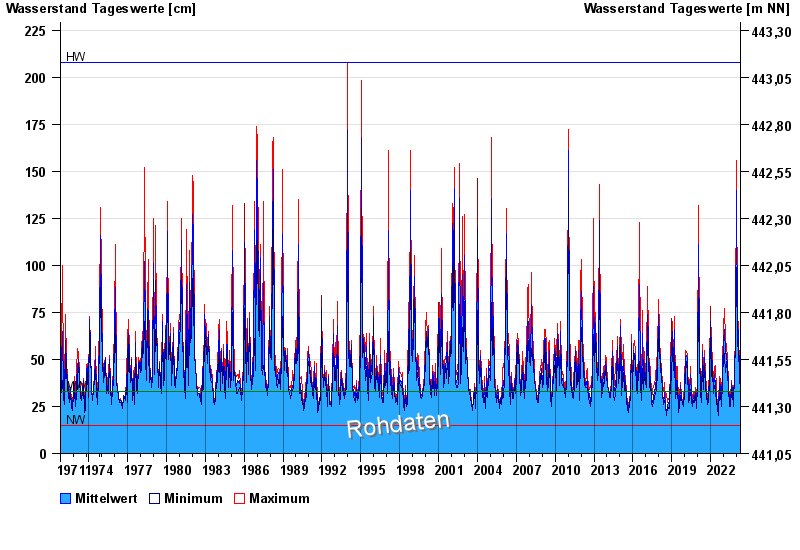
- Chart of total period

Chart of total period Rötz Speicherzufluss / Schwarzach
Waterlevel from 01.11.1971 to 20.04.2024
| Date | Mean value [cm] | Maximum [cm] | Minimum [cm] |
|---|---|---|---|
| 20.04.2024 | 62 | 62 | 60 |
| 19.04.2024 | 50 | 60 | 46 |
| 18.04.2024 | 48 | 52 | 43 |
| 17.04.2024 | 41 | 43 | 40 |
| 16.04.2024 | 37 | 41 | 35 |
| 15.04.2024 | 35 | 36 | 33 |
| 14.04.2024 | 33 | 34 | 33 |
© Bayerisches Landesamt für Umwelt 2024