
- Start >
- Rivers >
- Waterlevel >
- Untere Donau >
- Kinning >
- Chart of total period

Chart of total period Kinning / Rott
Waterlevel from 01.11.1973 to 26.04.2024
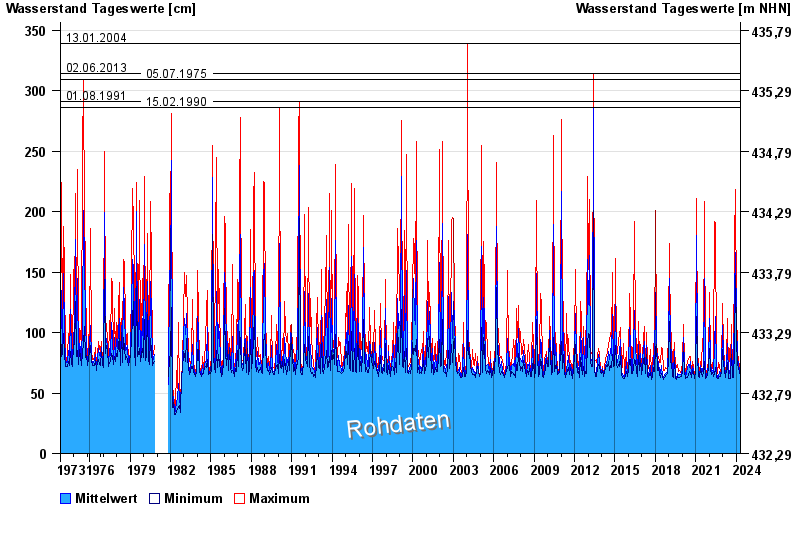
- 13.01.2004 Wasserstand: 339 cm
- 02.06.2013 Wasserstand: 314 cm
- 05.07.1975 Wasserstand: 309 cm
- 01.08.1991 Wasserstand: 291 cm
- 15.02.1990 Wasserstand: 286 cm
| Date | Mean value [cm] | Maximum [cm] | Minimum [cm] |
|---|---|---|---|
| 26.04.2024 | 66 | 67 | 66 |
| 25.04.2024 | 67 | 68 | 67 |
| 24.04.2024 | 67 | 69 | 67 |
| 23.04.2024 | 69 | 71 | 68 |
| 22.04.2024 | 76 | 82 | 71 |
| 21.04.2024 | 68 | 82 | 65 |
| 20.04.2024 | 67 | 67 | 66 |
© Bayerisches Landesamt für Umwelt 2024