
- Start >
- Rivers >
- Waterlevel >
- Untere Donau >
- Kinning >
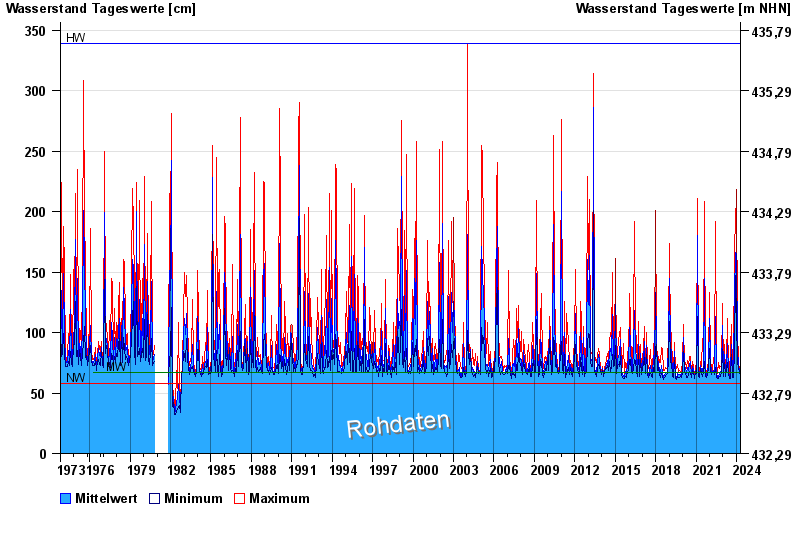
- Chart of total period

Chart of total period Kinning / Rott
Waterlevel from 01.11.1973 to 20.04.2024
| Date | Mean value [cm] | Maximum [cm] | Minimum [cm] |
|---|---|---|---|
| 20.04.2024 | 67 | 67 | 67 |
| 19.04.2024 | 66 | 67 | 65 |
| 18.04.2024 | 66 | 67 | 65 |
| 17.04.2024 | 66 | 68 | 65 |
| 16.04.2024 | 65 | 66 | 64 |
| 15.04.2024 | 66 | 68 | 64 |
| 14.04.2024 | 64 | 65 | 63 |
© Bayerisches Landesamt für Umwelt 2024