
- Start >
- Rivers >
- Waterlevel >
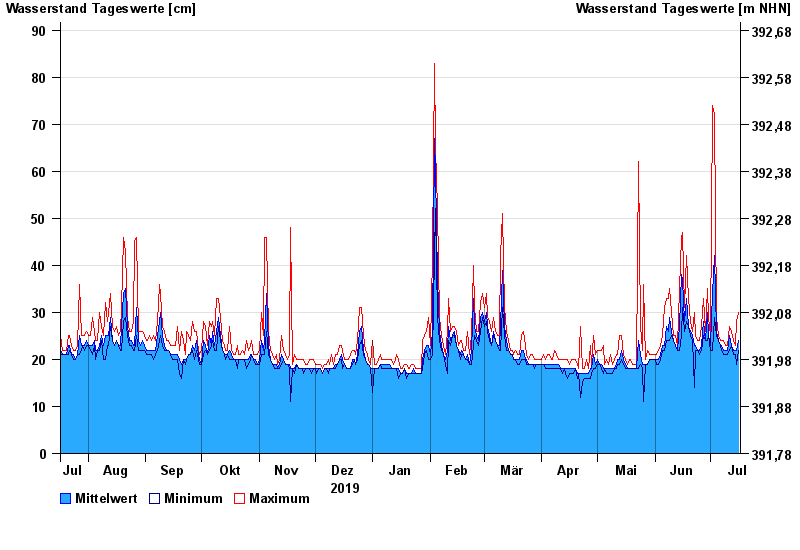
- Untere Donau >
- Altdorf >
- Chart of year

Chart of year Altdorf / Pfettrach
Waterlevel from 17.07.2019 to 16.07.2020
- 03.06.2013 Wasserstand: 177 cm
- 23.12.2012 Wasserstand: 119 cm
- 02.02.2013 Wasserstand: 111 cm
- 01.02.2016 Wasserstand: 107 cm
- 23.10.2014 Wasserstand: 104 cm
| Date | Mean value [cm] | Maximum [cm] | Minimum [cm] |
|---|---|---|---|
| 16.07.2020 | 24 | 30 | 22 |
| 15.07.2020 | 22 | 28 | 19 |
| 14.07.2020 | 22 | 23 | 21 |
| 13.07.2020 | 22 | 24 | 21 |
| 12.07.2020 | 23 | 26 | 23 |
| 11.07.2020 | 25 | 27 | 22 |
| 10.07.2020 | 22 | 23 | 21 |
© Bayerisches Landesamt für Umwelt 2024