
- Start >
- Rivers >
- Waterlevel >
- Untere Donau >
- Altdorf >
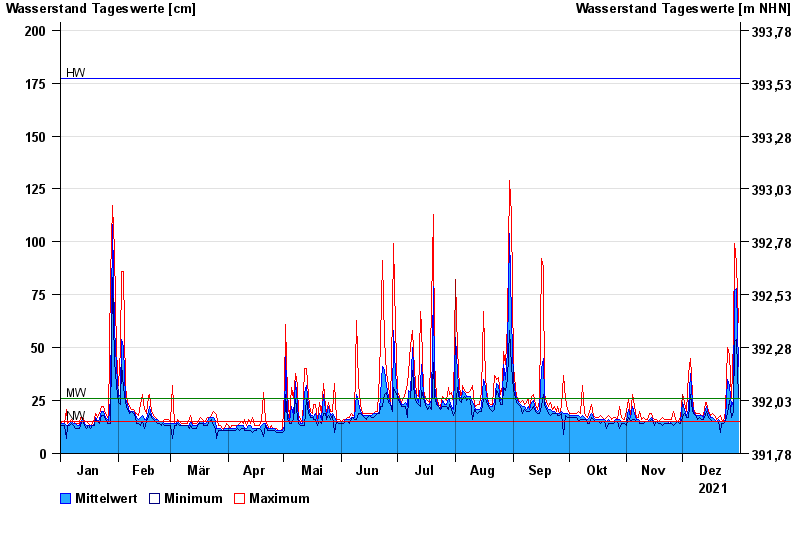
- Chart of year

Chart of year Altdorf / Pfettrach
Waterlevel from 01.01.2021 to 31.12.2021
note
Wasserstand von 08.-12.06.2024, 10:45h, wegen technischen Problemen unplausibel.
| Date | Mean value [cm] | Maximum [cm] | Minimum [cm] |
|---|---|---|---|
| 31.12.2021 | 41 | 62 | 26 |
| 30.12.2021 | 78 | 90 | 54 |
| 29.12.2021 | 77 | 99 | 53 |
| 28.12.2021 | 25 | 54 | 20 |
| 27.12.2021 | 22 | 26 | 17 |
| 26.12.2021 | 32 | 47 | 25 |
| 25.12.2021 | 35 | 50 | 19 |
© Bayerisches Landesamt für Umwelt 2024