
- Start >
- Rivers >
- Waterlevel >
- Naab - Regen >
- Untereppenried >
- Chart of total period

Chart of total period Untereppenried / Ascha
Waterlevel from 01.11.1969 to 27.04.2024
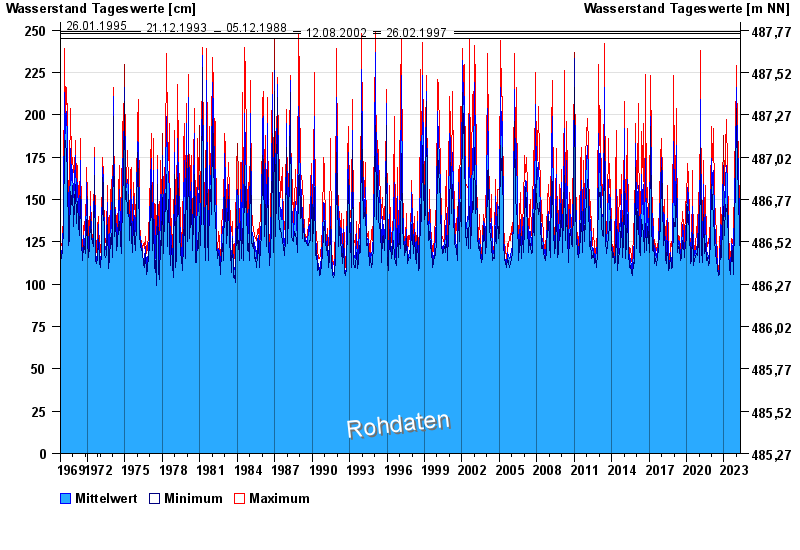
- 26.01.1995 Wasserstand: 249 cm
- 21.12.1993 Wasserstand: 248 cm
- 05.12.1988 Wasserstand: 248 cm
- 12.08.2002 Wasserstand: 245 cm
- 26.02.1997 Wasserstand: 245 cm
| Date | Mean value [cm] | Maximum [cm] | Minimum [cm] |
|---|---|---|---|
| 27.04.2024 | 122 | 122 | 122 |
| 26.04.2024 | 123 | 124 | 122 |
| 25.04.2024 | 122 | 122 | 121 |
| 24.04.2024 | 123 | 124 | 122 |
| 23.04.2024 | 126 | 130 | 124 |
| 22.04.2024 | 134 | 144 | 130 |
| 21.04.2024 | 139 | 151 | 131 |
© Bayerisches Landesamt für Umwelt 2024