
- Start >
- Rivers >
- Waterlevel >
- Naab - Regen >
- Untereppenried >
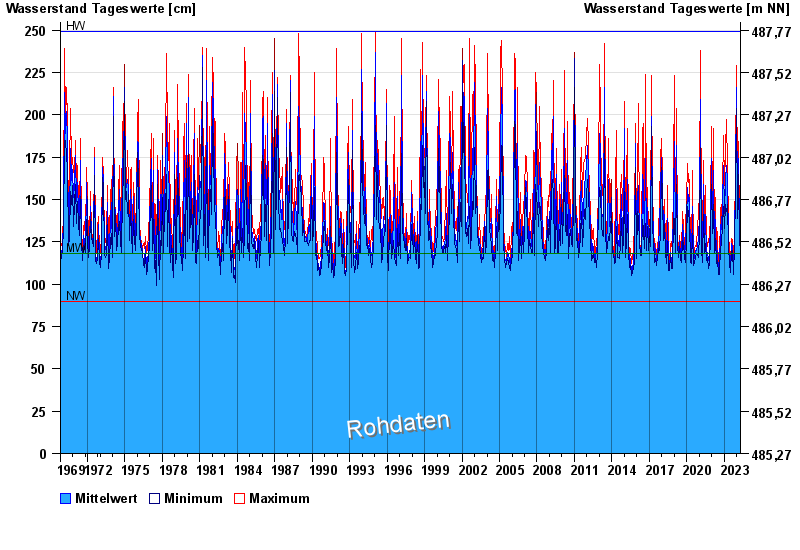
- Chart of total period

Chart of total period Untereppenried / Ascha
Waterlevel from 01.11.1969 to 20.04.2024
| Date | Mean value [cm] | Maximum [cm] | Minimum [cm] |
|---|---|---|---|
| 20.04.2024 | 150 | 150 | 150 |
| 19.04.2024 | 135 | 150 | 126 |
| 18.04.2024 | 125 | 128 | 124 |
| 17.04.2024 | 119 | 131 | 109 |
| 16.04.2024 | 116 | 119 | 114 |
| 15.04.2024 | 114 | 115 | 113 |
| 14.04.2024 | 113 | 113 | 112 |
© Bayerisches Landesamt für Umwelt 2024