
- Start >
- Rivers >
- Waterlevel >
- Naab - Regen >
- Unterbruck >
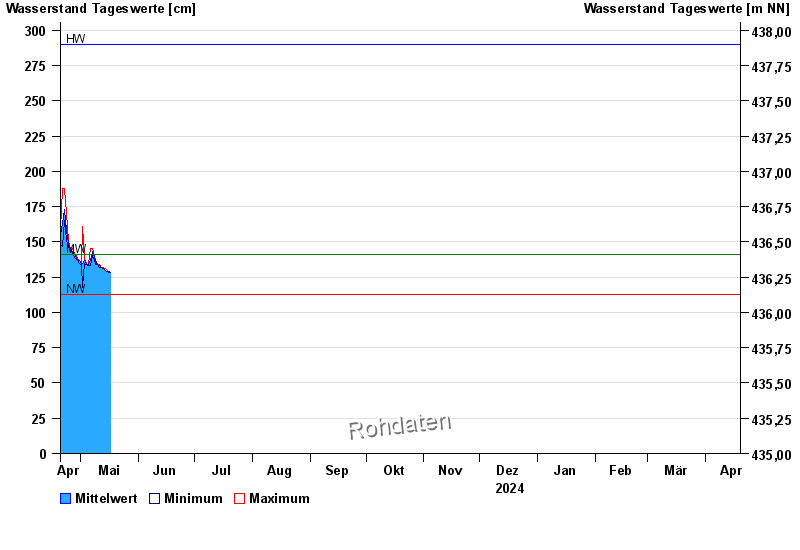
- Chart of year

Chart of year Unterbruck / Haidenaab
Waterlevel from 20.04.2024 to 19.04.2025
| Date | Mean value [cm] | Maximum [cm] | Minimum [cm] |
|---|---|---|---|
| 01.06.2024 | 147 | 148 | 146 |
| 31.05.2024 | 154 | 171 | 148 |
| 30.05.2024 | 150 | 162 | 139 |
| 29.05.2024 | 140 | 142 | 139 |
| 28.05.2024 | 144 | 150 | 141 |
| 27.05.2024 | 143 | 145 | 134 |
| 26.05.2024 | 151 | 157 | 145 |
© Bayerisches Landesamt für Umwelt 2024