
- Start >
- Rivers >
- Waterlevel >
- Naab - Regen >
- Unterbruck >
- Chart of year

Chart of year Unterbruck / Haidenaab
Waterlevel from 20.04.2024 to 19.04.2025
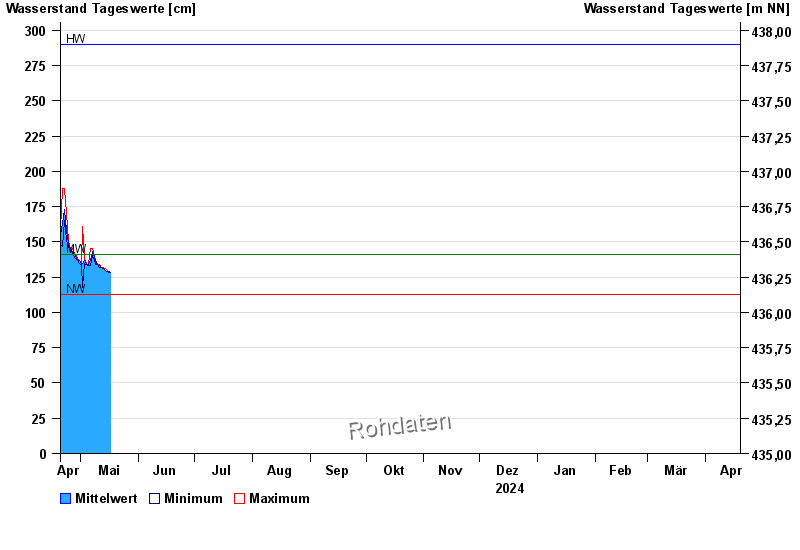
| Date | Mean value [cm] | Maximum [cm] | Minimum [cm] |
|---|---|---|---|
| 17.05.2024 | 128 | 128 | 128 |
| 16.05.2024 | 129 | 129 | 128 |
| 15.05.2024 | 129 | 130 | 129 |
| 14.05.2024 | 130 | 131 | 130 |
| 13.05.2024 | 131 | 132 | 131 |
| 12.05.2024 | 132 | 132 | 132 |
| 11.05.2024 | 133 | 134 | 132 |
© Bayerisches Landesamt für Umwelt 2024