
- Start >
- Rivers >
- Waterlevel >
- Naab - Regen >
- Trausnitz u. d. Mühle >
- Chart of total period

Chart of total period Trausnitz u. d. Mühle / Pfreimd
Waterlevel from 01.11.1969 to 26.04.2024
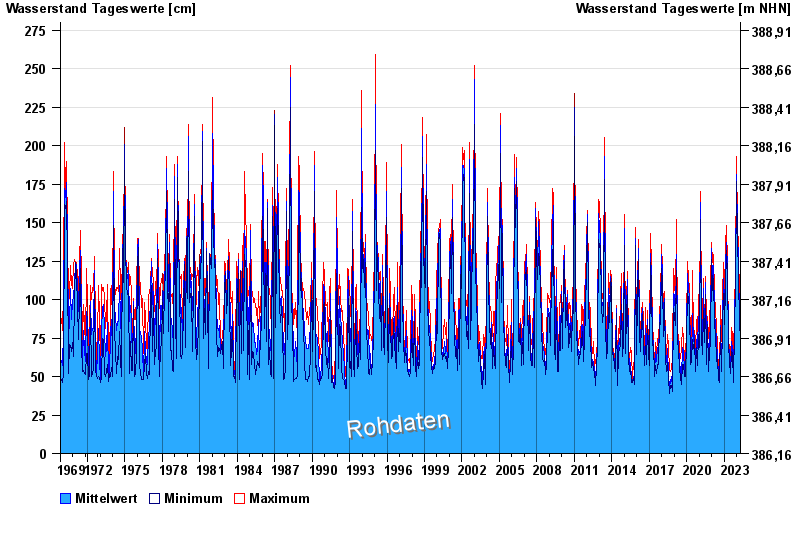
- 530 cm: Trausnitz: Überflutung der Mühle Kraus ca. 10 cm.
| Date | Mean value [cm] | Maximum [cm] | Minimum [cm] |
|---|---|---|---|
| 26.04.2024 | 76 | 79 | 72 |
| 25.04.2024 | 78 | 82 | 73 |
| 24.04.2024 | 81 | 91 | 71 |
| 23.04.2024 | 94 | 101 | 87 |
| 22.04.2024 | 97 | 101 | 94 |
| 21.04.2024 | 102 | 112 | 95 |
| 20.04.2024 | 93 | 112 | 82 |
© Bayerisches Landesamt für Umwelt 2024